Information Technology Reference
In-Depth Information
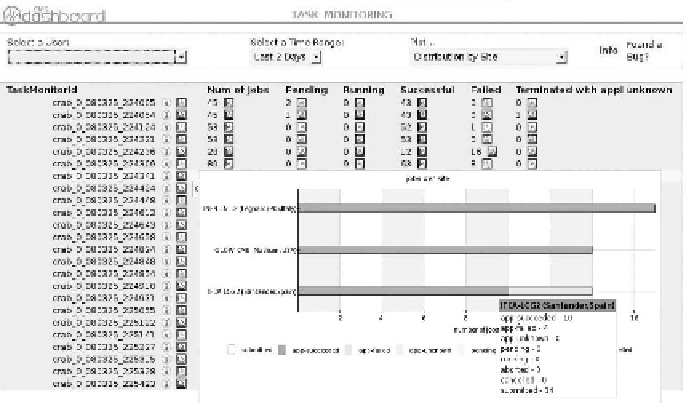
FIGURE 17.7
Dashboard Task Monitor. A snapshot of a user page is shown. There is the
possibility to have a breakdown of each task (normally a set of jobs sharing the same
executable running independently on a coherent dataset, i.e., a set of i les).
important to know that a user rarely submits single jobs. Due to the data
quantities to be analyzed, data are often organized in
datasets
; in general,
collections of i les containing a coherent collection of data. In this case the
action to analyze a single dataset generates (in this case within CRAB) a
set of jobs (e.g., one job per data i le). Jobs from a single user request may
be executed on different sites since data are replicated across the LCG
infrastructure (in Figure 17.7, the pop-up picture shows the execution of
one dataset across three sites).
The importance of an activity like the Dashboard is clear and docu-
mented by the interest in the HEP community (usage by the four LHC
experiments): the Dashboard provides unbiased views of the delivered
performances to specii c user communities by measuring the efi ciency of
the user's application by monitoring directly the activity of all users. All
of the project (and the Job Monitor in particular) has generated interest in
several other applications in EGEE. Biomedical applications (VL-eMed)
have adopted it and Diligent (Digital Libraries) is considering evaluating
it in their infrastructure.
In
Figure 17.8
we show another Dashboard application: Site Efi ciency.
In this case, the Dashboard shows the installation in use for VL-eMed
(the same application runs for the HEP communities as well). In
this application, job attempts are identii ed and the grid failures are cat-
egorized and associated with a given grid resource in a site. In case a job
is automatically resubmitted multiple times due to failures, each job
Search WWH ::

Custom Search