Information Technology Reference
In-Depth Information
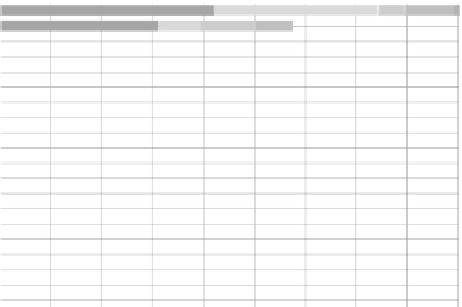
Jobs per site
USCMS-FNAL-WC1-CE2 (Batavia, USA)
USCMS-FNAL-WC1-CE (Batavia, USA)
IN2P3-CC (Lyon, France)
INFN-T1 (Bologna, Italy)
IN2P3-CC-T2 (Lyon, France)
INFN-PISA (Pisa, Italy)
unknown
FZK-LCG2 (Karlsruhe, Germany)
GLOW-CMS (Madison, USA)
USCMS-FNAL-WC1-CE (Batavia, USA)
app-succeeded - 80086
app-failed - 199
app-unknown - 1893
pending - 0
running - 0
aborted - 165
cancelled - 0
submitted - 82343
DESY-HH (Hamburg, Germany)
BEgrid_ULB-VUB (Brussels, Belgium)
UKI-LT2-IC-HEP (London, UK)
BelGrid-UCL (Louvain-la-Neuve, Belgium)
INFN-LNL-2 (Legnaro (PD), Italy)
BUDAPEST (Budapest, Hungary)
WARSAW-EGEE (Warsaw, Poland)
Nebraska (Lincoln, NE, USA)
MIT_CMS (Cambridge, MA, USA)
pic (Barcelona, Spain)
RAL-LCG2 (Oxford, UK)
25000
50000
Number of jobs
75000
100000
FIGURE 17.5
Dashboard Job Monitor. Summary of CMS production jobs (October 2007).
The Experiment Dashboard accounts for all CMS jobs on both the infrastructures used by
the experiment (EGEE and OSG).
(submitted by the CMS tools CRAB). These summary views are interest-
ing for both the resource managers at the participating sites and the ones
responsible for the computing of the experiment as a whole.
On the other hand, users are clearly more interested in concentrating
on their own work, in particular to pin down problems in their activity. In
Figure 17.7
we drilled down to the view provided for a given user. It is
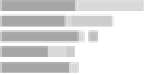
Jobs per site
CERN-PROD (Geneva, Switzerland)
USCMS-FNAL-WC1-CE2 Batavia, USA)
unknown
USCMS-FNAL-WC1-CE (Batavia, USA)
FZK-LCG2 (Karlsruhe, Germany)
Nebraska (Lincoln, NE, USA)
CIT_CMS_T2 (Pasadena, US)
CERN-PROD (Geneva, Switzerland)
app-succeeded - 41998
app-failed - 32507
app-unknown - 5156
pending - 0
running - 0
aborted - 9502
cancelled - 1285
submitted - 90448
BEgrid-ULB-VUB (Brussels, Belgium)
GLOW-CMS (Madison, USA)
UCSDT2-B (La Jolla, USA)
IFCA-LCG2 (Santander, Spain)
IN2P3-CC (Lyon, France)
IN2P3-CC-T2 (Lyon, France)
UFlorida-PG (Gainesville, USA)
Purdue-RCAC (West Lafayette, USA)
MIT_CMS (Cambridge, MA, USA)
Purdue-Lear (West Lafayette, USA)
CSCS_LCG2 (Manno, Switzerland)
RWTH-Aachen (Aachen, Germany)
INFN-T1 (Bologna, Italy)
10000
20000
30000
40000 50000
Number of jobs
60000
70000
80000
90000
FIGURE 17.6
Dashboard Job Monitor. Summary of CMS analysis jobs (October 2007). As
in Figure 17.5 the Experiment Dashboard accounts for all CMS jobs (submitted with the
CRAB system) on both the EGEE and OSG infrastructures used by the experiment.


Search WWH ::

Custom Search