Information Technology Reference
In-Depth Information
very simple and to make sure that if a job crashes or gets killed, the latest
result is still available. Since results were sent back every hour, on average a
job would waste one hour at most (out of several days of running).
We have exploited the natural parallelism (the 21 space-time lattice
i les) together with the free parameters in the coni guration i le. With
this strategy, around 450 jobs were submitted using Ganga to both the
EGEE grid and to the CERN LSF batch system. This resulted in about
9500 CPU cores to be used. The jobs ran for about one week after which
they were terminated (via Ganga). Within this week the results from
more than 30 CPU years could be harvested. A subset of these results
have been used for presentation in conferences as Lattice 2007. The jobs
ran on more than 50 sites, with a majority of jobs running on fast Intel
Xeon processors (see Figure 17.3).
This example is a neat demonstration of the power of Ganga as a tool to
facilitate the usage of the grid. The original goal to isolate HEP users from
the details of the execution back end led to the development of Ganga,
which is attracting users from different activities. Often new users dis-
cover the tool by themselves and then start using it.
Within the EGEE context, we have observed the value of Ganga also as
a tutorial tool. The choice of the Python language (its l exibility and the
availability of powerful extension modules) helps to guide the new users
into realistic scenarios without unnecessary technicalities. The i nal result
is that users end a three-hour tutorial and are in a position to continue
experimenting and preparing to use the EGEE production infrastructure
without further dedicated support effort. Ganga is used in ATLAS and
LHCb. ALICE and CMS designed their own strategies to support users
on the grid.
uk
9%
de
7%
6260
10,000
2549
edu
6%
749
unknown
11%
1000
it
5%
gov
4%
fr
3%
84
63
100
10
ch
14%
1
other
16%
org
24%
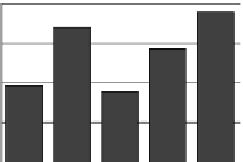
FIGURE 17.3
Distribution of top-level domains of the sites and the distribution of processors
used for the lattice QCD application. Note the log scale in the processor distribution plot.


Search WWH ::

Custom Search