Biology Reference
In-Depth Information
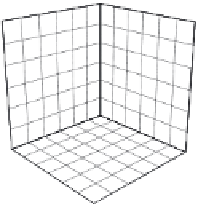
(a)
(b)
(c)
(d)
A
B
C
(e)
(f)
(g)
Fig. 6.22
(a) Three behavioural zones of an individual fish: A is a zone of repulsion (here individuals move
away from others to avoid collision). B is a zone of orientation (here individuals align with the movement of
others). C is a zone of attraction (here individuals move towards others). Computer simulations show that
different group structures can emerge simply as a result of changes in these zones. (b) With little or no
orientation zone, a swarm forms. (c) As the size of the orientation zone increases, the group forms a torus.
(d) As the zone of orientation increases still further, the group begins to move in one direction. From Couzin
et al
. 2002. (e) (f) (g): The three states in golden shinerfish
Notemigonus crysoleucas
. These are the only states
observed in many hours of tracking these fish. Photos courtesy of Iain D. Couzin.
around as individuals; and when both food and skin extract were introduced together,
shoals were intermediate in size. Fig. 6.23a summarizes these results in terms of median
group size. Do individuals vary group size by counting their companions? Not necessarily.
Different grouping may emerge as the outcomes of variation in local interactions.
Hoare
et al
. simulated the consequences of varying the radius of the zones of alignment
and attraction in Fig. 6.22a. They hypothesized that food odours would decrease these
zones (individuals less attracted to neighbours) while signals of a predator would
increase them (more attraction to neighbours). Simulations in which the zones were
varied in this way gave an excellent fit not only to the median observed group sizes in the
different treatments, but also to the variation in group sizes (Fig. 6.22b).
Future work needs to investigate the local rules actually used by individual fish to test
whether these predicted group consequences follow from real behaviour.
Leadership and voting
Leaders and followers
Consider a group of individuals, each with the three behavioural zones depicted in Fig.
6.22a. Now imagine that a small proportion has information about a preferred direction,
for example to a food source. All the others are naïve, with no preferred direction, and