Civil Engineering Reference
In-Depth Information
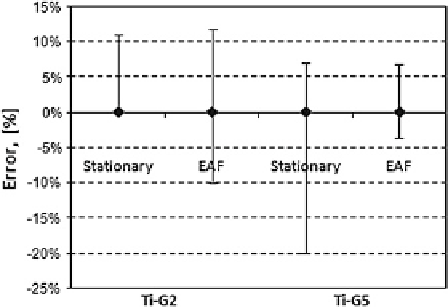
Fig. 4.17
Percent error
between model predictions
and experiments [
5
]. The
magnitude of the percent
error varied between the
material type and the test type
the larger
ξ
0
value, whereas the Ti-G5 EEC increased more consistently through-
out the length of the test, hence the larger
b
value.
The difference between model predictions and experiments was computed, and
the maximum and minimum differences as compared to the experimental meas-
urements of the temperature are presented in Fig.
4.17
. For most of the tests, the
model predicted the temperatures with less than 12 % error, while one of the tests
underestimated some of the values with about
−
20 %. Overall, the model predic-
tions agree well with the measurements, but refinement will be needed for greater
accuracy.
4.2.4 Thermal-Based EEC Conclusions
This section analyzed the thermo-mechanical aspects of the electroplastic effect. A
thermal model, accounting for material properties specifically for titanium alloys
various levels of plastic deformation, was verified using experimental EAF tests
[
4
]. The conclusions from this section are as follows:
• EAF reduced the low stress in both Ti-G2 and Ti-G5. Although just one current
was used, 300 A DC, based on previous work, similar results are expected for
different currents.
• To account for varying differences in thermal proiles between the conventional/
EAF tests, a new EEC was introduced, which was defined by a power law
relation.
• The EECs for the two Ti-grades were signiicantly different. This could be
because the grades of titanium were different. Ti-G2 is a single phase poly-
crystalline material, and Ti-G5 is a dual-phase alpha-beta alloy. For Ti-G2, the
electrons were able to travel easier because they only had to move through one
phase. This can be seen by noticing the steeper and higher EEC for Ti-G2 com-
pared to Ti-G5.