Civil Engineering Reference
In-Depth Information
600
CD 25
500
400
CD 20
300
CD 15
200
CD 10
100
0
0
2
4
6
8
10
Time, [s]
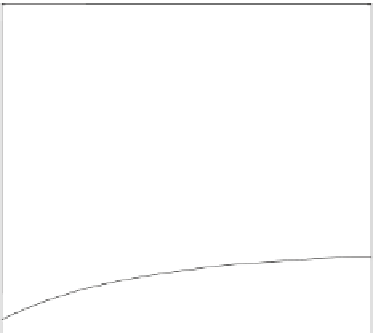
Fig. 4.11
Stationary electrical modeling tests at different starting current densities for SS304.
The resistive heating thermal model was tested on various materials with different starting cur-
rent densities prior to integrating in the effect of deformation
the middle of the test, but is accurate at the beginning and end of the test. Additionally,
the heating profile of the model is slower than that of the experiments.
Figure
4.10
shows the modeled thermal profile of a stationary electrical test for
only one specific starting current density. Please note that prior to incorporating
plastic deformation into the model, the resistive heating-only model was verified
at different starting current densities. Figure
4.11
shows the model results of four
different starting current densities for SS304 (note that the modeling uses titanium,
however, the model was validated on several different materials, and this figure
displays its results on Stainless Steel 304). Now that the model can effectively
predict resistive heating effects, the effect of plastic deformation must now be
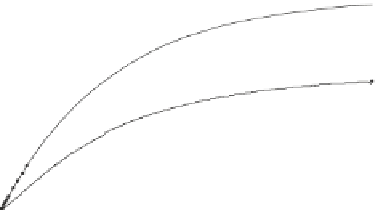
included to represent an actual EAF test. The temperatures recorded are presented
in Fig.
4.12
for Ti-G2. The EAF deformation test is compared with the stationary
tests for intermediate stages of deformation, i.e., 6 s for L
1
and 12 s for L
2
(the
test durations are list in Table
4.2
). The temperatures generated during stationary
electrical tests due to resistive heating are greater than the EAF deformation tests.
The difference cannot be explained simply by the very small difference in the
cross-sectional area (the machined specimens do not have barreling), but by the
difference in the dislocation density. Moreover, during the EAF deformation test, a
significant portion of the electric power goes toward assisting plastic deformation,
rather than direct resistive heating. Knowing this, the EEC can be determined from
the difference in thermal profiles of the model and experimental EAF tests, after
deducting the temperature profile for the conventional forming test.
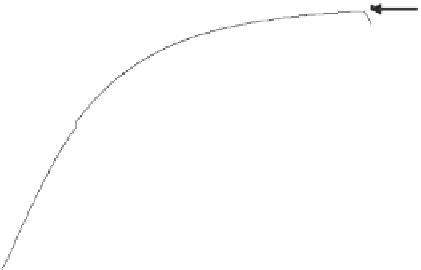
After experimenting with different EEC relations, the model and experimental
EAF thermal profiles were matched using a power law function (Eq.
4.7
) to repre-
sent the EEC, as shown in Fig.
4.13
.