Civil Engineering Reference
In-Depth Information
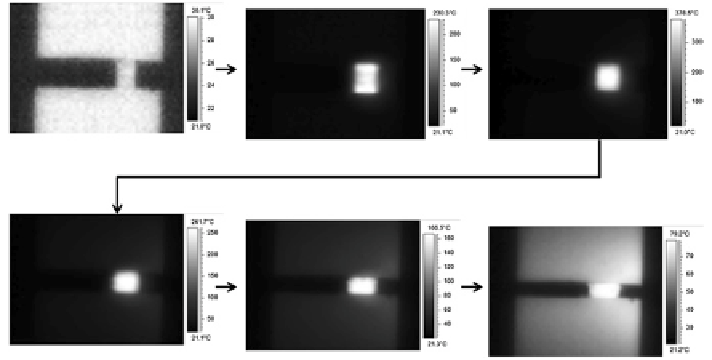
Fig. 9.11
Heating and cooling sequences for enhanced asperities at the top and bottom of the
specimens [
6
]. In the case of the enhanced asperities being at the top and bottom of the speci-
men, the heat is generated at the top and bottom of the specimen very briefly, and then this heat
moves to the center of the specimen, ultimately making this location the hottest
particular locations. Figure
9.9
has the enhanced asperities on the top face, and
from the thermal profiles, this is the hottest area at the beginning of the test (notice
the white color signifying the hottest temperature). Figure
9.10
has the enhanced
asperities at the bottom face, and this area is the hottest at the beginning of the
test. Figure
9.11
has the enhanced asperities at the top and bottom faces and both
of these areas are approximately equally the hottest locations at the beginning of
the test. These three experiments show that, where there is a significant change
in the contact area (larger than the micro-level), the temperature will be affected.
However, this change in temperature is only noticed briefly at the beginning of the
test, and then the center of the specimen becomes the hottest location for all three
tests. The heat transfer during EAF can be affected by many different variables
(i.e., different forms of heat transfer, die volume, etc.) and the specific effects of
these variables will be discussed in Chap.
3
.
Figure
9.12
shows stationary electrical thermal profiles for specimens which
were surface ground using a 320-grit wheel to an average roughness value of
0.539 µm. It can be seen that, as the static load is increased, the temperature also
decreases by a small extent. Please note that all of these static loads were within
the elastic region of the specimens, so the apparent contact between the dies/speci-
men did not change.
Figure
9.13
displays the thermal profiles for stationary electrical tests run on
specimens with a “Large CA” surface roughness. From the figure, the tempera-
tures at static loads of 1,335 and 2,000 N are much higher than the temperatures at
the other, heavier loads, which were into the plastic regime of the asperity portion
of the specimens. Of note is that the 1,335 and 2,000 N loads are still within the
elastic region of the “Large CA” region, but the other three loads are toward the