Civil Engineering Reference
In-Depth Information
result of non-uniform local strains present during EAF. The resultant micrographs
for orientation 1 are given in Figs.
8.23
,
8.24
, and
8.25
for L3 to L1, respectively.
From visual examination, there is a significant change from location L3 to L1
where the grain size decreases and is smallest at the fracture location (L1). This
is in agreement with the prior results where the grain size decreases with greater
amounts of strain. This gradient in microstructure is observed here as the amount
of local strain increases from L3 to L1, and in this orientation, the grain decreases
in overall diameter.
The average grain size for the EAF (800 A; 0.5-60 s) test in orientation 1 at
L3 is 5.80 µm with a standard deviation of 1.96 µm. For the same test at L2, the
average grain size is 5.66 µm with a standard deviation of 1.55 µm, and at L3, the
average grain size is 5.41 µm with a standard deviation of 1.74 µm. Although the
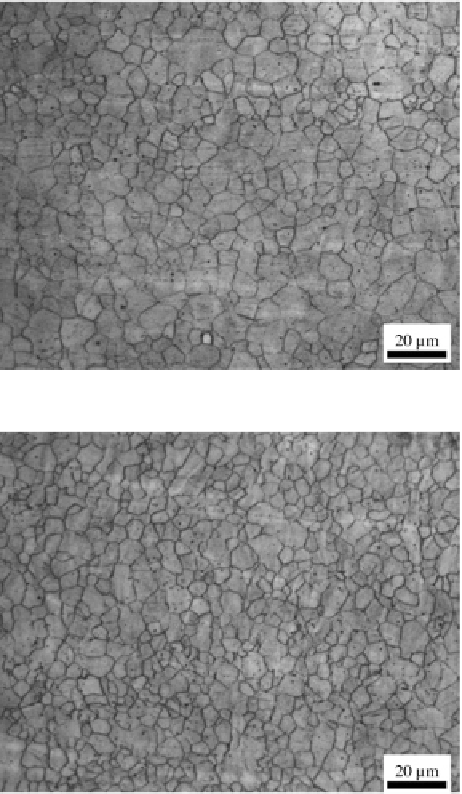
Fig. 8.23
Microstructure of
EAF (800 A; 0.5-60 s) test
(sample 16) in orientation
1 at L3
Fig. 8.24
Microstructure of
EAF (800 A; 0.5-60 s) test
(sample 15) in orientation
1 at L2