Civil Engineering Reference
In-Depth Information
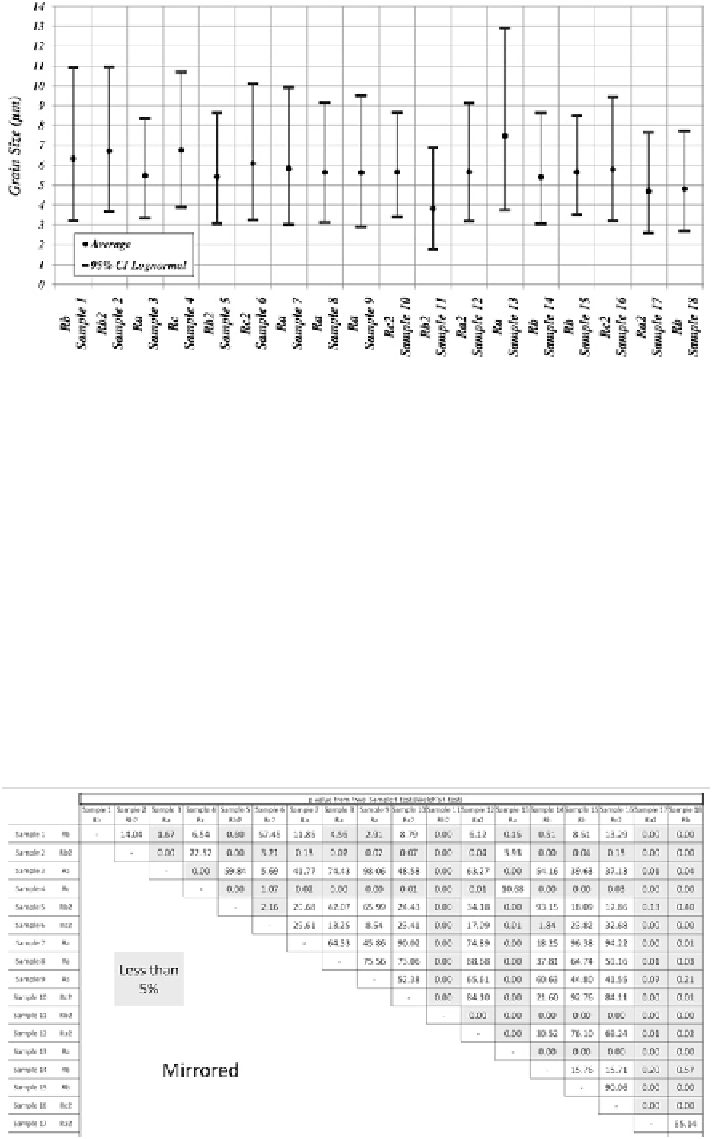
Fig. 8.19
Average and 95 % lognormal confidence interval for all microstructure samples in ori-
entation 1
there is not a great difference in the average grain size (3.82-7.48 µm) or variance
(2.41-8.45 µm
2
).
The results for the statistical tests are given in Tables
8.7
and
8.8
for orientation
1. The values from the tests that are lower than 5 % are highlighted to show the
samples which do not provide statistical equality assuming a 95 % confidence level.
The average equivalent circular grain size for all samples in orientation 2 is
given in Fig.
8.20
along with a 95 % lognormal confidence interval. Again, there is
not a great difference in the average grain size (4.18-7.01 µm) or variance (1.66-
5.77 µm
2
) for all the samples examined in this work.
The results for the statistical tests (
t
test and Levene/Bartlett tests) are given in
Tables
8.9
and
8.10
for orientation 2. The values from the tests that are lower than
Table 8.7
Two-sample
t
test results for all microstructure samples in orientation 1