Civil Engineering Reference
In-Depth Information
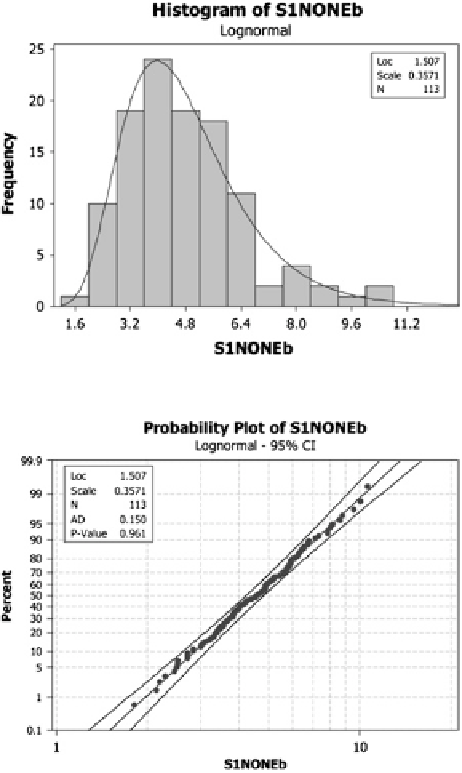
Fig. 8.16
Lognormal
histogram of equivalent
circular grain size for the
as-received material in
orientation 3
Fig. 8.17
Lognormal
probability plot of equivalent
circular grain size for the
as-received material in
orientation 3
were equivalent. This was performed as each micrograph is only displaying a
small portion of the actual mounted sample. This analysis was conducted, and it
was concluded that the micrograph image location for a given orientation did not
have a significant influence on the measured distribution estimation. The analysis
was conducted on the as-received material. The average equivalent circular grain
sizes for images a, b, and c of orientation 3 are shown in Fig.
8.18
along with a
95 % lognormal confidence interval (CI) as an example.
To specifically determine whether there is a statistical difference between the
data sets, two different test methods were used. To perform the tests, the data were
first transformed to normal by taking the natural logarithm of the data sets such
that the tests performed would be valid (since the statistical tests require assump-
tion of normally distributed data sets). After performing the tests, it can be inferred
from the results if the original data sets were equivalent.