Civil Engineering Reference
In-Depth Information
was increased due to the fact that the greater amount of cold work had a larger
number of interfacial defects within the lattice. With the greater number of dislo-
cations, the flowing electrons had more obstacles to scatter off, and thus, the heat-
ing of the workpiece was increased.
In addition to analyzing the thermal profiles of stationary electrical tests, the
thermal profiles of worked and non-worked specimens undergoing conventional
compression and EAF tests were also evaluated. In the thermal plots for EAF com-
pression tests, the temperature will decrease at some point in the test, where the
maximum temperature will not be at the end of the test, as was the case with the
stationary electrical tests. This is due to the increasing cross-sectional area on the
specimens as they are compressed. Specifically, the current used to make the start-
ing current density is held constant, and therefore, the current density decreases
over the duration of the test. This causes the specimen temperature to peak at some
point in the test and then reduce for the remainder of the test.
Figures
8.9
and
8.10
show the thermal profiles of 20 % worked/non-worked spec-
imens undergoing conventional compression and EAF compression, respectively. In
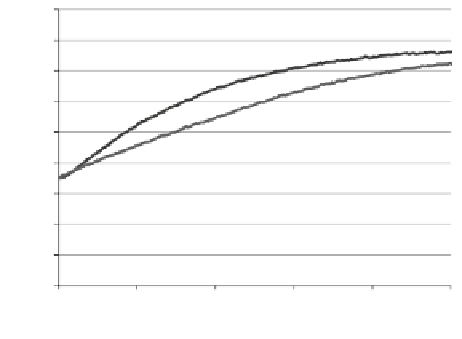
Fig. 8.9
20 %CW/annealed
thermal profiles (conventional
compression) [
5
]. The
cold-worked conventional
compression thermal profile
was no greater than 10 °C
higher than the thermal
profile of the annealed
specimen
90
80
70
20% CW
60
50
20% Anneal
40
30
20
10
0
0
2
4
6
8
10
Time (s)
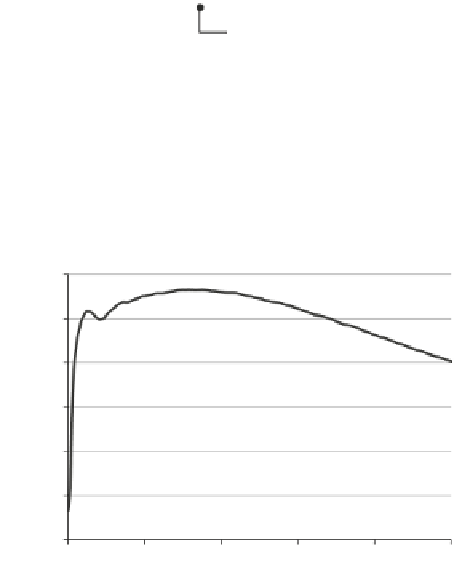
Fig. 8.10
20 %CW/annealed
thermal profiles (EAF tests at
800 A) [
5
]. As was the case
with the stationary electrical
tests, the cold-worked
specimen temperature profile
for the EAF tests was higher
than the annealed specimen's
temperature profile. The
largest recorded difference
throughout the tests was
about 30 °C
300
20% CW
250
20% Anneal
200
150
100
50
0
0
2
4
6
8
10
Time (s)