Civil Engineering Reference
In-Depth Information
6.1.2 Experimental Setup
To validate and examine the results from the derived models, experimental tests
were carried out with varying test conditions using a square wave input as this
will create transient thermal periods for robust model validation. The testing con-
ditions are listed in Table
6.2
. As can be seen, two current densities were examined
(increased during test), three pulse durations were used, and the pulse period was
held constant. For the conditions in Table
6.2
(Parameter Sets 1-4), both stationary
(i.e., no deformation) and deformation tests with a platen speed of 2.54 mm/min
(corresponds to an initial true strain rate of 0.0004 s
−
1
) were performed with two
replications. As a result of the repeatability of the test results (force/thermal), this
replication number was deemed sufficient. The maximum thermal difference was
less than 3 °C for all thermal tests, and the average force difference was 5 MPa.
Parameter Set 0 represents conventional room temperature forming.
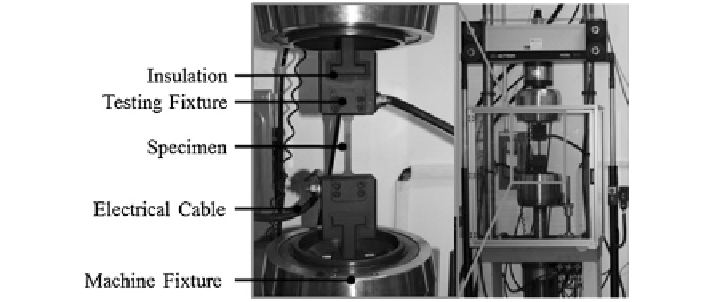
The experimental setup of the testing is shown in Fig.
6.4
. An Instron hydrau-
lic testing machine with specialized tensile grips to isolate the electricity from the
testing equipment was used to deform the tensile specimens. For the mechanical
response, force and displacement (resolution of 0.0254 mm) were collected and
this allowed for the mechanical strain and stress to be calculated. The tensile
specimens started as 20
×
200 mm sheet strips and were prepared according to
ASTM Standard B557M [
1
]. A thin layer of ceramic paint was applied on one side
to reduce emissivity issues for thermal response measurements, while the other
side of the specimen was acid-etched with a strain grid for (CGA). The material
tested in this study was Mg AZ31B warm-rolled sheet, and the test region had a
cross section of 1 mm thick by 12.5 mm wide per ASTM Standard B557M [
1
].
To measure the thermal response during the test, a FLIR A40M thermal camera
(upper temperature capacity 550 °C, temperature resolution 0.1 °C, and frame rate
12.5/s) was used (not shown in Fig.
6.4
).
Fig. 6.4
Experimental testing setup [
4
]