Civil Engineering Reference
In-Depth Information
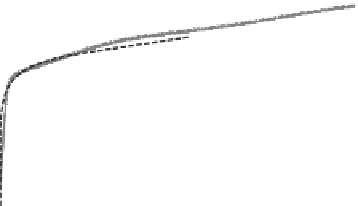
Fig. 5.12
Flow stress model
(12.7 mm/min) [
13
]. The
model and experiments
generally agree for all of the
tests, with a percent error of
less than 10 %
1400
1200
1000
800
CD20- Exp
600
CD10- Exp
CD20- Model
Base- Exp
400
CD10- Model
200
Base- Model
0
0
0.2
0.4
0.6
0.8
1
True Strain
Fig. 5.13
Flow stress
model (25.4 mm/min) [
13
].
The model is not able to
predict the strain weakening
to the same extent as the
experiments, but to within a
percent error of about 20 %
1400
1200
1000
800
CD25 -
Exp
600
Baseline -
Exp
400
CD25 -
Model
Baseline -
Model
200
0
0
0.2
0.4
0.6
0.8
1
True Strain
5.2.7 Electrical Efficiency Analysis
Within this subsection, the efficiency of the EAF tests run and how the EEC can
be interpreted are discussed [
13
]. As previously mentioned, the EEC represents the
efficiency of the applied electrical power on the manufacturing process. To this
end, the magnitude of the EEC profile is determined on the effect that the applied
electrical power has, and not just on the amount of applied electrical power. More
specifically, if excess electrical power is added to the process and it cannot be uti-
lized for plastic deformation assistance, it will contribute only to resistive heating
and will result in a lower EEC.
Figure
5.14
displays EEC values at 50 and 100 % of the total compressive
stroke for both die speeds of 12.7 and 25.4 mm/min, at the current densities
tested for each die speed. The percentage of the total compressive stroke was used
instead of time such that the two different die speeds could be compared to each
other. From the figure, for both die speeds, the EECs were higher at 100 % stroke
compared to 50 % stroke. This signifies that the efficiency of the applied electri-
cal power (which is represented by the EEC) increases throughout the test and it
increased at a higher rate with the slower die speed. With the EAF technique being