Agriculture Reference
In-Depth Information
The PLU (price lookup) code found on most fresh produce can be used to identify
organic or transgenic produce. If the first number in the code is 9, this indicates
the product is organically produced. If the fist number in the code is 8, this indi-
cates the product is transgenic. If the first number is a zero (0), then the product is
neither organic nor transgenic.
The important question is: “Why are farmers changing their practices so
rapidly?” This rate of adoption is even more surprising when we realize that it often
requires purchase of more expensive seed. Herbicide-tolerant crops are very specific
as to which herbicide they will tolerate. Purchase of the seed requires a contract
promise by the farmer not to save and use seed for the next planting. This also increases
costs. Despite higher seed costs, overall production costs remain at similar levels or can
be lower with the use of transgenic crops. Examples of realized reductions on inputs
may include a reduced need for tillage, crop scouting, and a potential for an overall
reduction in the amount of pesticides required for the control of diseases, insects,
and weeds. An increase in net economic returns can be realized with transgenic
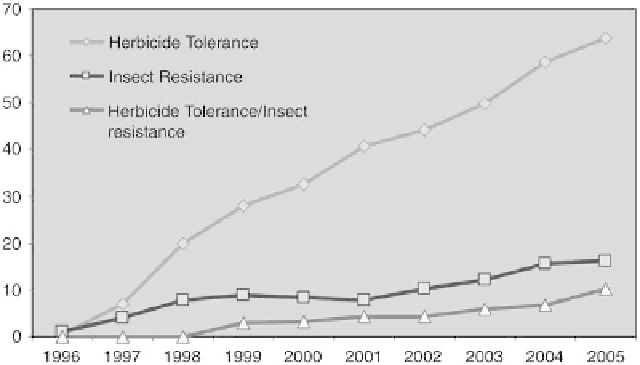
crops due to better protection of the plants favoring higher yields. A second view of
the total hectares planted in Figure 12.10 gives us an idea of the types of transgenic
traits being adopted. Herbicide resistance is the most popular trait of the new crops,
followed by insect resistance, and then by the combination of the two traits, often
referred to as stacked traits.
One practice many U.S. farmers have been adopting for crops such as maize is
called no-till. Conventional tillage, practiced for thousands of years, requires that the
farmer first plow the field, then disk the field to break up clods or clumps of soil,
and to destroy weeds. Sometimes the farmer must pass over the same field three to
four times before the soil is sufficiently pulverized to permit planting. After planting,
Figure
12.10.
Global area of biotech crops by trait (1996- 2005). (From Ref. 23. Used by
permission of International Service for the Acquisition of Agri-Biotech Applications.)