Biology Reference
In-Depth Information
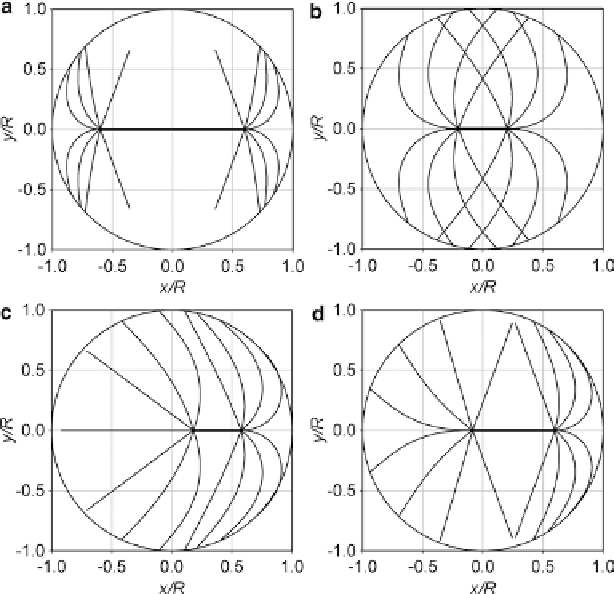
Fig. 13
Sample equilibrium conformations. Plotting conventions as in Fig.
7
. In all examples,
q
max
= 0.6π. (
a
)
L
= 0.7
R
,
S
= 1.2
R
. (
b
,
c
) represent the alternative conformations that exist with
L
= 1.1
R
and
S
= 0.4
R
. (
d
)
L
= 0.95
R
,
S
= 0.7
R
. Reproduced from Maly (
2012
) under the Creative
Commons Attribution License
the symmetric to asymmetric state in the case plotted in Fig.
10b
(dotted curve) is
then 65 pN. Note that the barrier for switching from the asymmetric state is higher,
156 pN. The above estimates were order-of-magnitude for
N
and
R
in a generic cell,
and a mid-range experimental value was used for EI (Mickey and Howard
1995
).
Equally relevant may be the values
N
= 1,000 and
R
= 5 μm, in which case the two
barriers will be 2.6 and 6.2 nN. Targeted measurements are needed to determine if
such barriers (~0.1-1 nN) can be overcome in a given cell type.
So far we have considered the position of the spindle proper (the segment con-
necting the spindle poles) along the axis of symmetry of the spindle,
x
, character-
izing it by
x
s
, the coordinate of the center of the spindle proper. The analysis of
forces during displacement of the spindle proper along
x
demonstrates that the cen-
tral symmetry can be stable or unstable with respect to axisymmetric perturbations.
It can also be demonstrated that the system displays the same type of behavior with
respect to nonaxisymmetric perturbations, specifically that the axial symmetry can
be stable or unstable (depending on the structural parameters) with respect to