Agriculture Reference
In-Depth Information
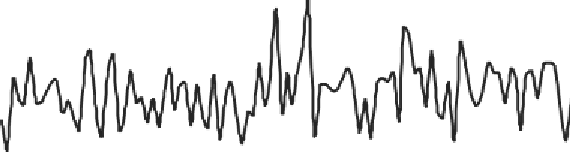
Figure 2. Rainfall in the Murray-Darling Basin
900
800
700
600
500
400
300
200
100
0
1900
1920
1940
1960
1980
2000
Ca lendar Yea r
Source:
Bureau of Meteorology, 2005.
Table 1. Ratio between the maximum and minimum annual flows from select rivers
Country
River
Maximum to minimum annual flows
Brazil
Amazon
1.3
Switzerland
Rhine
1.9
China
Yangtze
2.0
Sudan
White Nile
2.4
USA
Potomac
3.9
South Africa
Orange
16.9
Murray
Australia
15.5
Australia
Hunter
54.3
Darling
Australia
4 705.2
Annual runoff in the basin is about 24,000 GL/yr. Under natural conditions, about
11,000 GL /yr is consumed by wetlands and /or floodplains and about 13,000 GL/yr
flows to the sea. The Murray River forms part of the New South Wales and Victorian
state border and the Darling River forms part of the New South Wales and Queensland
border.
This paper profiles the Murray-Darling Basin and the management of natural
resources through the Murray-Darling Basin Commission. The Commission is an
example of inter-jurisdictional management of rivers and catchments — a consequence of
federation and state boundaries.


Search WWH ::

Custom Search