Agriculture Reference
In-Depth Information
is easier than in a plain area with a variety of irrigation sources such as rivers, streams,
and reservoirs even in the same area. But we need to consider a factor such as mother
rocks as a general standard for classification for an extended application from the area of
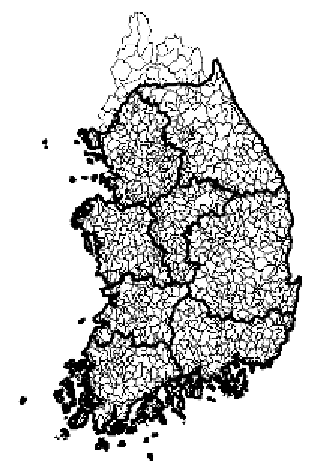
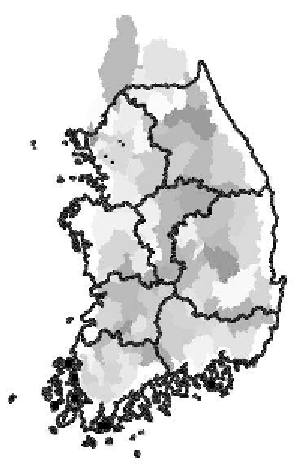
a case study to another site. Figure 5 is a watershed map showing results classified by
characteristics of topography and mother rocks. Digital maps used for this classification
were a 25,000 index map and a standard watershed map and river map, a super-detailed
soil map, and a topographic map. Using altitude and characteristics of mother rocks with
granite, porphyry, shale, sandstone, conglomerate, etc, the analysis of similarity with
geological characteristics was made.
Figure 5. Watershed map classified based on topographical characteristics
and mother materials
(a) Large-sized watershed (b) Middle-sized watershed (c) Small-sized watershed
2. Pollution load assessment by a watershed
Pollution from agriculture is the result of inflow of pollutants from livestock waste
and living sewage of the rural community, etc. into soil or a water body in an agricultural
area. Point sources can be identified and managed by law and education, etc., but the
management and control of non-point sources isn't easier than that of point sources. Non-
point source pollutants transported into water by rainfall is a significant contributor to
water quality degradation in surface water. Two methods for monitoring and modeling
can be used to assess the pollutant loads. Monitoring is a direct method to evaluate the
pollution in a given site with time, but the cost is expensive and a lot of time is consumed.
The evaluation model for watershed is less accurate than the direct evaluation by
monitoring of pollutants at given sites, but this model can predict the status of pollution in
the future and can help us better understand the relationship between water quality and
farming. Figure 6 shows one system for pollution load assessment. This system was
produced by watershed drawing using a digital standard watershed map, a land use map


Search WWH ::

Custom Search