Agriculture Reference
In-Depth Information
The study was carried out using a model with CTM, the same as in the first study
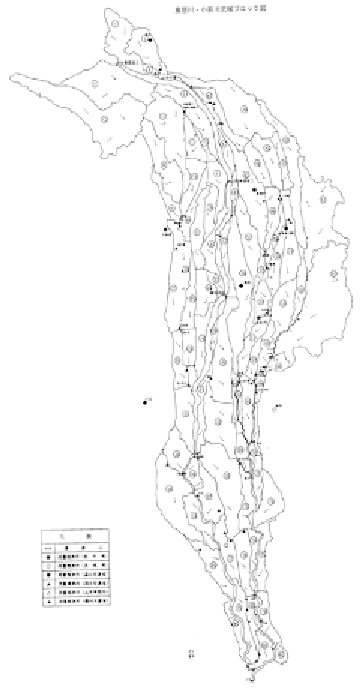
basin. Figure 17 shows a ground plan of the Kino River Basin and division system into
81 sub-basins. The average of annual mean relative errors of simulated daily river flow to
the observed one during 6 years, from 1998 to 2003, ranged between 11.1% and 18.7% at
Okamoto, 20.1% and 36.6% at Katsuu, 18.7% and 30.5% at Hirakata, and 17.9% and
24.2% at Mitsukaido. It means that the model simulates with a good accuracy at each
point in most years. Figure 18 shows the result of calculations revealing that, on average
during the irrigation period in 2000 and 2001, 98% of the equivalent amount of intake
water at Sanuki D.W. and 84% of the equivalent amount of intake water at Okamoto
D.W. return to the Kinu and Kokai river at several downstream points.
Figure 17. Plan of the Kinu and Kokai River Basin and division into sub-basins
Sanuki
D. W.
Okamoto D.W.
Kat suu D. W.


Search WWH ::

Custom Search