Agriculture Reference
In-Depth Information
Any strategy will result in a set of long-term probabilities
of being in the various states s. If the average annual volume of water released while in
state s is
then
is the overall average annual water release, and
is the average penalty incurred each year. F
s
denotes the average penalty incurred in state
s if a high flow event is not achieved. A penalty is incurred for states
or higher
if the minimum flow rate required is not achieved for at least
days.
If the flow rate is maintained between and days, a variable penalty
F(t)
might be applied to reflect the value of a partial success discussed earlier. The penalty
might decline to zero as the event approaches
at a decreasing, constant or increasing
rate.
The release strategy
The release strategy is based on the curve shown in Figure E and the volume of water
on call. The estimated curves define the threshold level of expected release requirements
for each day of the release window in each season, below which the event is initiated and
up to the volume of water on call is released. As the release windows are discontinuous
between seasons, a separate curve is specified for each state
s
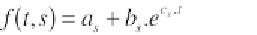
. An exponential functional
form was selected as a compromise between flexibility and the number of parameters,
,
and
to be estimated:
Whenever
then a high flow event attempt is initiated.
A solved example
The objective is to have a high flow event at least once every five years ( = 5).
The minimum daily flow requirement at Wagga Wagga is 30 gigalitres a day
(
F
= 30 gigalitres). A minimum of ten consecutive days at or above this flow rate is
required to generate a high flow ( = 10) and reset the state
s
= 1. However, the
expected release requirements are calculated to generate a 14 day high flow event


Search WWH ::

Custom Search