Environmental Engineering Reference
In-Depth Information
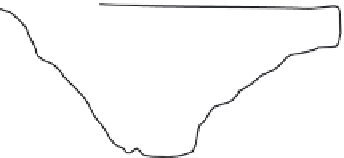
Water surface = HGL
h
L
Q
Slope =
h
L
/L
Channel bottom
L
figure 2.21 Steady uniform open channel flow, where the slope of the
water surface (or HGL) is equal to the slope of the channel bottom.
downward in the direction of flow. Energy loss is evident as the water
surface elevation drops. Figure 2.21 illustrates a typical profile view of
uniform steady flow. The slope of the water surface represents the rate
of energy loss. Figure 2.22 shows typical cross-sections of open chan-
nel flow. In Figure 2.22A, the pipe is only partially filled with water and
there is a free surface at atmospheric pressure. This is still open channel
flow, although the pipe is a closed underground conduit. Remember, the
important point is that gravity and not a pump is moving the water.
Note:
Rate of energy loss (see Figure 2.21) may be expressed as the ratio
of the drop in elevation of the surface in the reach to the length of the
reach.
2.13 floW MeasureMenT
Although it is clear that maintaining water/wastewater flow is at
the heart of any treatment process, clearly it is the measurement of flow
that is essential to ensuring the proper operation of a water/wastewater
treatment system. Few knowledgeable operators would argue with this
statement. Hauser (1996, p. 91) asked: “Why measure flow?” Then she
explained: “The most vital activities in the operation of water and waste-
water treatment plants are dependent on a knowledge of how much water
is being processed.”
Ground surface
Pipe crown
Air
Stream
Buried pipe
partial flow
Pipe invert
(A)
(B)
figure 2.22 Open channel flow, whether in a surface stream or in an
underground pipe. (Adapted from Nathanson, J.A.,
Basic environmental
Technology: Water Supply, Waste management, and Pollution Control
,
Prentice Hall, Upper Saddle River, NJ, 1997, p. 35.)