Civil Engineering Reference
In-Depth Information
80
Warrington 8 19-NFC-sZ
rope diameter d = 16.7 mm
met. cross section A = 91.2 mm
2
nominal strength R
o
= 1570 N/mm
2
measuring length L = 2000 mm
A
B
C
800
kN
N
mm
2
60
600
40
400
20
200
0
0
0
2
4
6
8
10
12
‰
14
rope extension
ʵ
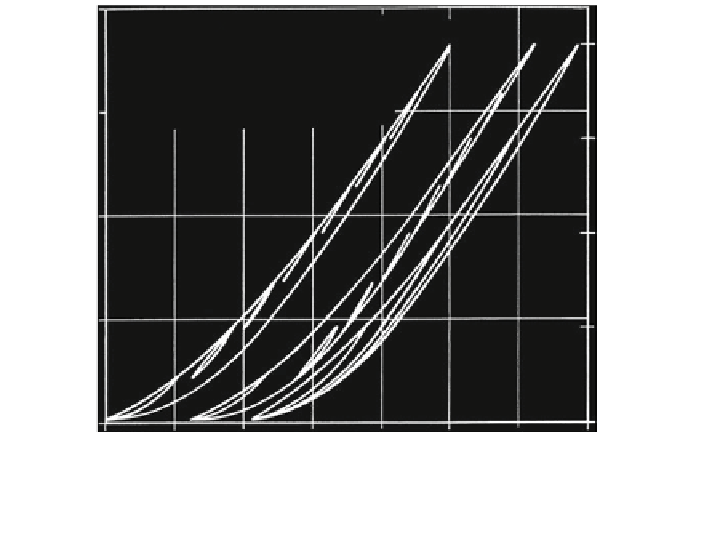
Fig. 2.14
Stress-extension curves with loading between different stresses, Feyrer and Jahne
(
1990
)
Figure
2.14
shows the stress-extension curves for the loading and unloading of
the wire rope from Fig.
2.12
after the tenth loading cycle. Between the rope tensile
stresses 0 and 800 N/mm
2
, the tensile stress changes in small steps. In loop A, the
tensile stress increases starting from r
z
= 0 in steps of Dr
z
= 100 N/mm
2
and
reduces the stress at every level reached in a small stress loop r
upper
-
r
lower
= Dr
z
= 100 N/mm
2
. The two lowest partial loops still show a clear
hysteresis, but the others do not.
Loop B is again loaded in stress steps of Dr
z
= 100 N/mm
2
but now starting
from r
z
= 800 N/mm
2
in a ''down'' direction. The two lowest partial loops show a
clear hysteresis as in loop A. The partial loops for the same stresses r
lower
and
r
upper
in the loops A and B are practically parallel. They represent the rope
elasticity modules E
S
(r
lower,
r
upper
).
In loop C some partial loops of stress-extension curves are shown, starting from
r
z
= 0 to the upper stresses r
upper
= 200, 400 and 600 N/mm
2
. The loading
curves are the same for all upper stresses. The unloading curves from these upper
stresses can be taken approximately as a part of the entire unloading curve from
the upper stress 800-0 N/mm
2
, turned around the point for r
z
= 0.
Search WWH ::

Custom Search