Civil Engineering Reference
In-Depth Information
1500
N
_
2.10
6
wire break
o run outs
N/mm
2
1000
800
5
50
95
600
failure probability Q in %
400
10
3
10
4
10
5
10
6
10
7
number of rotary bending cycles N
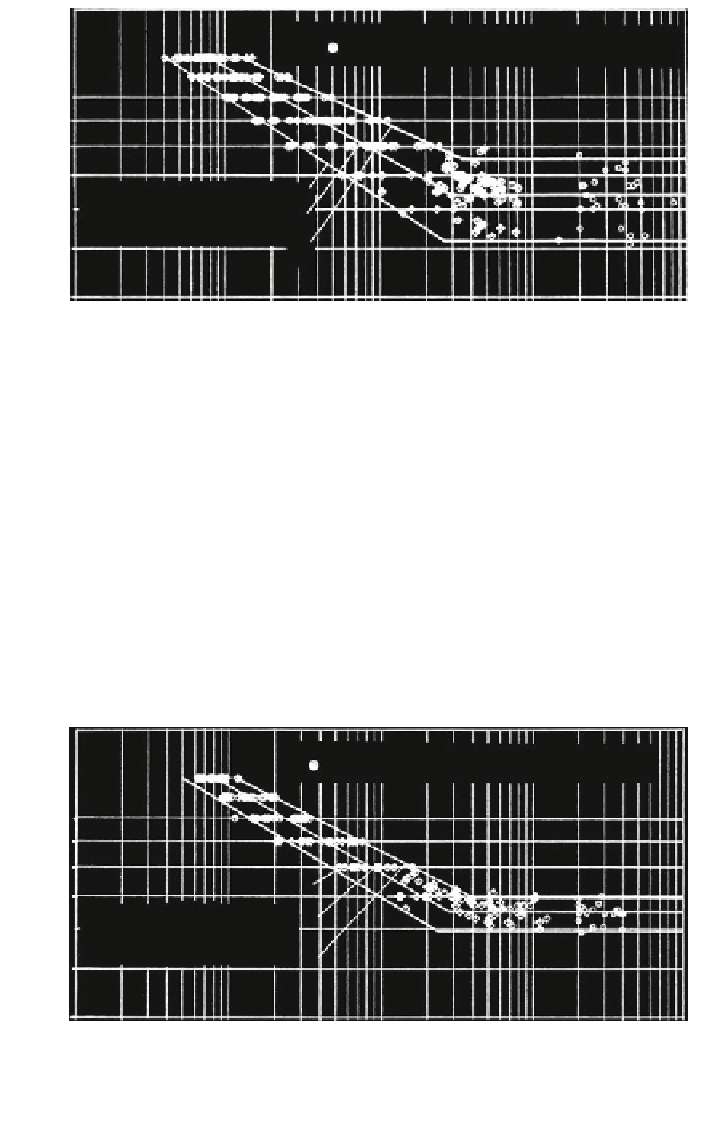
Fig. 1.11
Wöhler-diagram for wires, diameter d = 1 mm, from Seale ropes, Wolf (
1987
)
Wolf (
1987
) transferred this number of bending cycles to a Wöhler diagram as
shown in Fig.
1.11
. In the Wöhler diagram, he drew a line for the mean number of
bending cycles and lines for 5 and 95 % of the breaking probability. The mean
rotary bending strength (infinite life fatigue strength) for wires in 12 Seale ropes is
r
Rot
¼
640 N/mm
2
. In the Wöhler diagram shown in Fig.
1.12
, the number of
rotary bending cycles for 0.95 mm diameter wires taken from 20 Warrington ropes
has been transferred in the same way. The mean rotary bending strength is
r
Rot
¼
640 N/mm
2
. The deviation for the number of rotary bending cycles N and
1500
N
_
2.10
6
wire break
o run outs
N/mm
2
1000
800
5
95
50
50
600
failure probability Q in %
5
95
400
10
3
10
4
10
5
10
6
10
7
number of rotary bending cycles N
Fig. 1.12
Wöhler-diagram for wires, diameter d = 0.95 mm, from Warrington ropes, Wolf
(
1987
)


Search WWH ::

Custom Search