Civil Engineering Reference
In-Depth Information
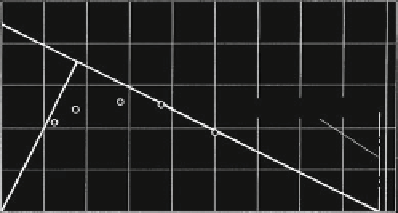
Fig. 2.36 Haigh diagram for
wire rope C, resin socket,
number of load cycles
N = 100,000
500
N
mm
2
400
300
F
oDIN
/d
2
= 884 N/mm
2
200
100
0
N/mm
2
0
200
400
600
800
mean specific load S
m
/d
2
lower force. Therefore, an evaluation using this equation can only be done sepa-
rately
for
different
lower
force
segments.
This
means
that
this
method
is
unsatisfactory.
Haigh diagrams have been designed for a bigger number of test results. As an
example, the best one—that is, the diagram where the test results follow the
Goodman line at least in part—is shown in Fig.
2.36
. In this figure, the force range
2S
a
/d
2
has been drawn for the number of load cycles N = 100,000 of the wire rope
C, in Table
2.10
. Because the number of load cycles cannot be gained using direct
testing, the drawn force ranges 2S
a
in Fig.
2.36
are evaluated by interpolation. For
smaller middle forces, the force range is drawn using points. For larger middle
forces, the force range follows the Goodman line which is also drawn in Fig.
2.36
.
A limit line starting from the origin of coordinates has been introduced for the
lower force S
lower
= 0, because the wire rope cannot transfer a compressive force.
The force range 2S
a
is small for small middle forces S
m
. It increases at first and
then reduces with the growing middle force S
m
along the Goodman line. Where
this reduction begins, the upper force S
upper
= S
m
+ S
a
(of the oscillating force)
reaches 75 % of the calculated breaking force of the rope.
Therefore the force range 2S
a
resulting from the tests with a stranded wire rope
is not represented at all by a Goodman line in the region of practical usage.
The reduced force range 2S
a
for small middle forces is caused by the additional
stresses arising from the bigger fluctuating contraction of the wire rope in this
force region, see Sect.
2.1
. The wire rope is not a piece of material for which the
Goodman line is valid. The additional stresses distinguish the wire rope as a
machine element rather than as a piece of material.
2.6.2.2 Endurance Formula
Numerous tension-tension fatigue tests have been carried out on three resin-
socketed round strand wire ropes A, B and C (as listed in Table
2.10
) by sys-
tematically varying the forces in order to determine a better method for evaluating
the test results. After a number of trials, the best regression equation for the

Search WWH ::

Custom Search