Environmental Engineering Reference
In-Depth Information
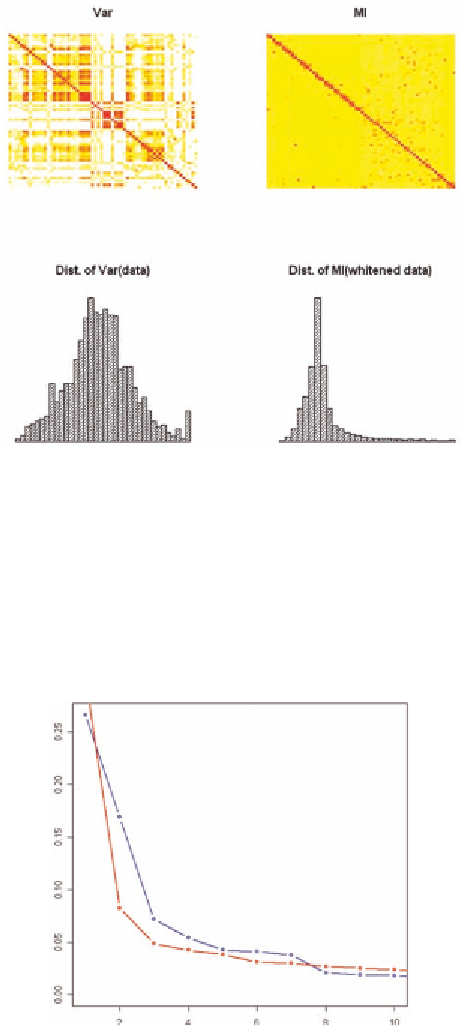
Figure 5. Image plots of covariance and mutual information matrices of ESI data - both matrices scaled
for comparison. Mutual information matrix calculated via copula on `whitened' (PCA output) data.
Darker color indicates greater covariance/mutual information. Image plot of MI illustrates remaining
variation/information. Histogram of MI reveals the same - PCA alone ignores remaining non-Gaussian
information. The MI matrix features high information about the diagonal; this is supported by the proxi-
mate listing of similar variables in the ESI data
/
∑
Figure 6. Scree plot [Catell 1966]: The y-axis is
λ
λ
, where
λ
i
the i
th
largest eigenvalue of the
i
i
i
Singular Value Decomposition (SVD). The graph is an illustration of the `variation' explained up to the
i
th
component. The red line is the scree graph for PCA components on the ESI dataset; the blue line is
for the CICA components. The area under each curve is the percentage of total 'variation' - then - at
each component. Seven (7) components for the PCA and CICA graphs are, respectively, 57.6 and 68.3
of the total`variation'