Environmental Engineering Reference
In-Depth Information
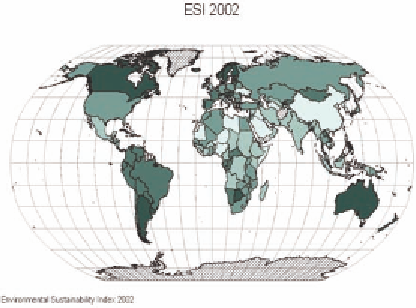
Figure 1. The 2002 ESI. Darker color indicated
a higher, more 'sustainable score on the index.
Canada and Norway, for example, are more 'sus-
tainable' than China or the United States
Constructing the ESI using only available
cases would have severely restricted its scope;
yet it was important to have a reasonability check
for the imputations, In Abayomi [2008] we look
at the fit of a chained equation imputation model
to the completed data and we suggested post hoc
diagnostics designed to account for inconsistency
and missingness in multivariate data collected
from multiple sources.
The ESI was calculated, using the equation in
(1), on the completed - post-imputation - data. The
use of the inverse standard normal distribution in
(1) guaranteed scores on the range 0-100; scaling
each variable by its sample standard deviation
set the contribution of each in deviation units;
combining variables in groups before average
allowed each component to have equal contribu-
tion to the overall score. Generally, countries with
higher GDP scored higher in the ESI - though
the relationship is not perfect. For example, the
United States scored lower than Canada, and
China scored lower than Australia.
An illustration of the final, completed data
ESI is in Figure 1.
Multivariate analysis via PCA is a venerable
member of the statistical canon; PCA results are
often intermediate steps in larger investigations
where the component outputs may be inputs in
standard predictor-response models or more gen-
eralized 'indices' of higher order measurements.
See Oja [1992], for example.
In Independent Component Analysis (ICA)
the minimization of off-diagonal variation in
y
is strengthened to statistical independence, beyond
the second order condition. Here, the goal is to
find the linear transformation (i.e. rotation matrix)
of
x
k
,
y
CICA FOR DETERMINANTS OF
ENVIRONMENTAL SUSTAINABILITY
The Component Analysis Procedure
=
B
, such that the observed
y
i
=
x
are
nonlinearly
correlated (in the maximal correla-
tion sense [see Hyvarinen 2001]) of
y
j
=
x
; here
the model for statistical independence is explicit.
The observed data are modeled as mixed outputs
x
x
Given multivariate data
x
k
, the goal in Principal
Component Analysis (PCA) is to find the linear
transformation (i.e. rotation matrix),
y
=
B
, that
minimizes the off-diagonal variance of
y
. When
Σ =
x
=
A
, of independent sources
s
. The columns
of
Y
are the estimates of these independent com-
ponents, or signals; which the rotation
B
is an
estimate of
A
−1
. See Figure 2, a la Cardoso [1996].
Typically, independent signals
s
are observed
via unknown full rank rotation
A
as
x
. The
ICA/BSS procedure yields
y =
·
outputs as esti-
mates of the independent signals. The distribution
of the inputs and outputs should be proportional.
s
Cov y
i j i j
1
is the covariance matrix
of
x
k
the very well known result is to generate
the Eigenvectors for Σ
((
(
,
)))
,
=
..
=
e
t
:Λis a diagonal
matrix of Eigenvalues - which yields
y
i
Λ
=
e x
,
with Cov(y_i,y_j) = 0,
i
≠ , or the rotation
which yields linear independence (see Johnson
and Wichern [1998] for a comprehensive take).
t