Environmental Engineering Reference
In-Depth Information
8.2.2
Types of projects
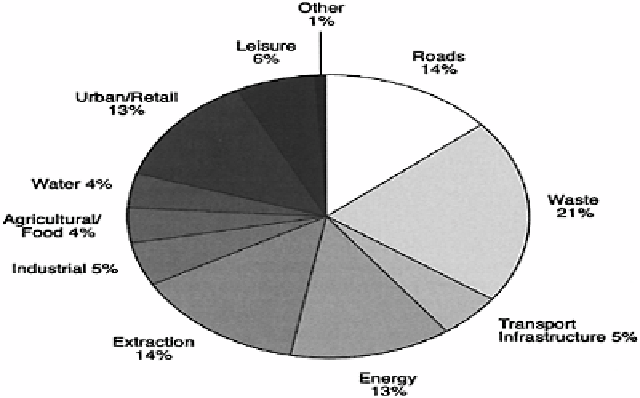
Figure 8.2 shows the types of projects for which EISs have been prepared. The largest
numbers are for project types in waste,
1
urban/retail developments, roads, extraction
schemes and energy projects (Wood & Bellanger 1998). Less than 10 per cent of these
projects were Schedule 1 projects, primarily toxic waste disposal installations, power
stations and motorways (Wood 2003).
Although these ratios have remained broadly steady over the years, some project types
show clear trends and the incidence of EIS activity provides an interesting barometer of
development activity and associated policies (Figures 8.3a-d). For instance, in response
to privatization and the “dash for gas” the number of EISs for combined-cycle gas turbine
power stations peaked at about ten per year (1989-93), falling back to about three per
year (1994-98). EISs for roads increased steadily from about 30 in 1989 to about 80 in
1993 as a result of the roads programme, but fell back in the mid-late 1990s, given
restrictions on government funding of road construction and policy trends towards traffic
management. EISs for incinerators and wastewater treatment plants grew rapidly until
1992, as the government worked to meet EC quality standards, and then levelled off or
fell back. The number of business park EISs dropped sharply in the early 1990s, as the
recession affected speculative development (Frost & Wenham 1996, Wood & Bellanger
1998).
Figure 8.2
Trends in EISs for
particular project types (1988-98).
(
Source:
Wood & Bellanger 1998.)
Search WWH ::

Custom Search