Agriculture Reference
In-Depth Information
least for one For given
k
and
j
, the two boundaries (inequalities) can
be stacked in (Keane 1993)
Dropping
the
kj
subscripts, the sequence of errors
can be further stacked over the sample period
,2...,T,
as where with
Matrix
A
is a lower-triangular matrix of the Cholesky decomposition of the
covariance
t=
1
matrix
such
that
Using
these
definitions, (4.7) can be written as (Keane 1993):
The GHK simulation technique is to first sequentially draw the
errors from a truncated univariate normal distribution such that
they are consistent with the observed choices,
i.e.,
the inequality (4.8)
given above holds for each draw. The simulation is started at time
t =1
by
drawing (with other being zero) for each farm
i
such that the
draw is consistent wit the observed choice,
i.e.
the draw satisfies the
inequality
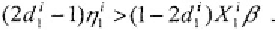
If we observe
the truncation point consistent with the
observed choice is:
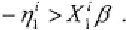
Alternatively, if
the
corresponding truncation point is:
Next, the truncation point is updated by substituting the first draw,
say
for
in (4.8). The second error
is drawn using the updated
truncation point
and substituting this new draw for in (4.8). This procedure is
continued until
t=T.
The sequence of these
T
draws is repeated
S
times for
each firm
i.
The second step is to form the corresponding unbiased simulators
for the transition probabilities. Because the computation of these transition
probabilities follows a well-established procedure and derivation of these
transition probabilities is lengthy, the derivation is omitted here. A detailed


Search WWH ::

Custom Search