Agriculture Reference
In-Depth Information
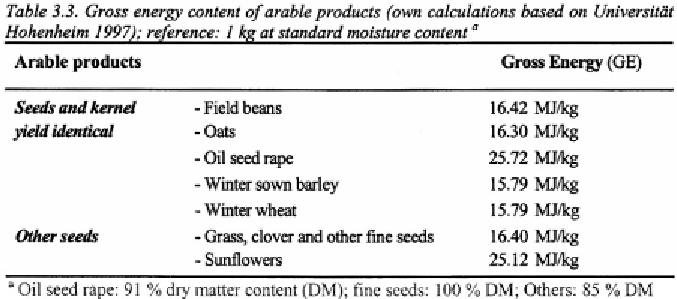
coefficients for seeds as shown in Table 3.2 reflect only the energy
necessary for their supply; energy content is given by the figures in Table
3.3.
3. RESULTS
System comparisons of energy input as well as of energy intensity and
energy productivity for the farming systems were carried out on different
levels. Due to differences in the length of rotations (three and four years
respectively), the comparison of the farming systems refers to average
values for a mean year of each crop rotation. The reliability of the results at
this level is investigated afterwards by comparing mean values of all crops
between years and by comparing different cultivated crops.
3.1 Energy input
Though considerable relative reductions of the energy input are achievable
in some input groups of the integrated systems (Table 3.4), the absolute
energy savings were most important in the group 'N-fertiliser', followed by
fuel and pesticide use. The energy input for machinery was higher in the
integrated systems because of less optimal conditions of depreciation
compared to the conventional systems. The last result depends on the
applied allocation rules (Table 3.4). Other energy inputs depend directly on
the amount of yield (electricity use and basic fertilisation). Therefore, they
were only indirectly influenced by changes in the farming systems.
Search WWH ::

Custom Search