Information Technology Reference
In-Depth Information
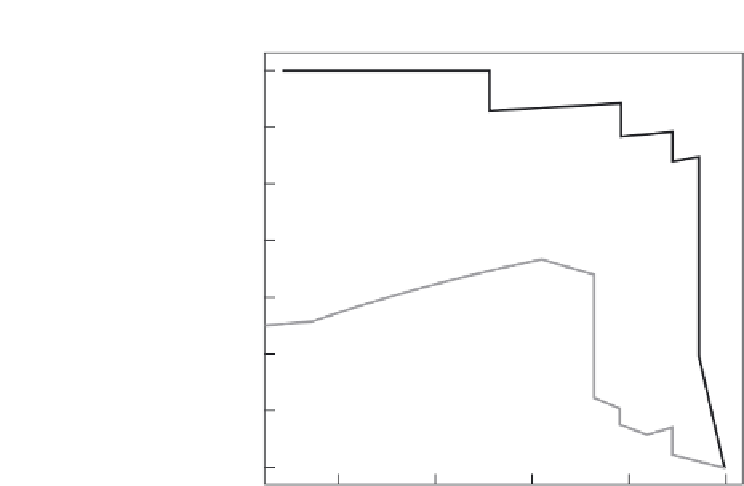
Precision/recall graphs
1.00
0.95
0.90
0.85
0.80
0.75
0.70
0.65
0.6
0.7
0.8
0.9
1.0
Recall
Figure 8.4
The precision-recall curves illustration for two scoring classifiers.
documents in the sample. The curves, thus, look different from ROC curves as
they have a negative slope. This is because precision decreases as recall increases.
PR curves are a popular visualization technique in the information retrieval field
as illustrated by our earlier examples that discussed the notions of precision
and recall. Further, it has been suggested that PR curves are sometimes more
appropriate than ROC curves in the event of highly imbalanced data [15].
8.4.4 AUC
The AUC represents the performance of a classifier averaged over all the possible
cost ratios. Noting that the ROC space is a unit square, it can be clearly seen that
the AUC for a classifier
f
is such that AUC
(f )
∈
[0
,
1] with the upper bound
attained for a perfect classifier (one with TPR
0). Moreover, as
can be noted, the random classifier represented by the diagonal cuts the ROC
space in half and hence AUC
(f
random
)
=
0
.
5. For a classifier with a reasonably
better performance than random guessing, we would expect to have an AUC
greater than 0
.
5.
Elaborate methods have been suggested to calculate the AUC. However, using
the Wilcoxon's rank sum statistic, we can obtain a simpler manner of estimating
the AUC for ranking classifiers. To the scores assigned by the classifier to each
test instance, we associate a rank in the order of decreasing scores. That is, the
=
1 and FPR
=


Search WWH ::

Custom Search