Information Technology Reference
In-Depth Information
1
0.9
Normal
0.8
REA
0.7
SMOTE
0.6
SERA
0.5
UB
0.4
5
10
15
20
25
30
35
40
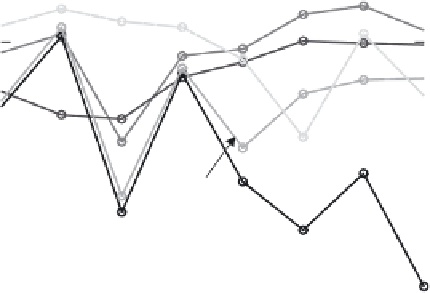
(a) OA of algorithms in comparison for ELEC dataset
1
REA
0.9
SERA
0.8
SMOTE
0.7
0.6
UB
Normal
0.5
5
10
15
20
25
30
35
40
(b)
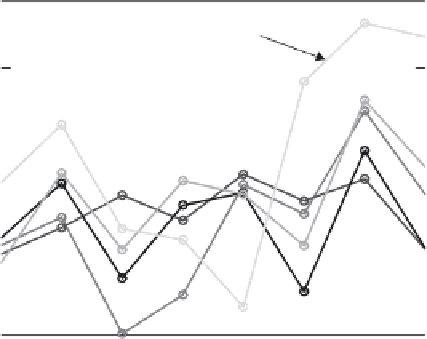
AUC of algorithms in comparison for ELEC dataset
Figure 7.8
OA and AUROC for ELEC dataset.
all instances into minority class. Since the imbalanced class ratio is just 0
.
05,
this dumb method can achieve 95% OA all the time on testing datasets, but it
should never be considered in practice as it fails entirely on minority class. This
fact reassures that OA is really not a good choice for validating algorithms on
imbalanced datasets. The other fact that can be observed is that REA provides
consistently higher OA rate than UB, which again resonates with the theoretical
analysis in Section 7.3.
Figure 7.8b shows the averaged AUROC of the comparative algorithms. As
complements, Figure 7.9 shows the ROC curves averaged by 10 random runs
of comparative algorithms on data chunks 10 (Fig. 7.9a), 20 (Fig. 7.9b), 30


Search WWH ::

Custom Search