Information Technology Reference
In-Depth Information
1
0.95
0.9
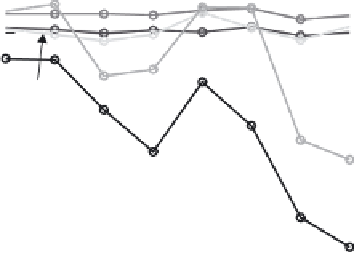
SMOTE
0.85
SERA
Normal
0.8
0.75
UB
REA
0.7
0.65
0.6
0.55
5
10
15
20
25
30
35
40
(a) OA of algorithms in
comparison for SEA dataset
1
REA
0.95
SERA
0.9
Normal
SMOTE
UB
0.85
5
10
15
20
25
30
35
40
(b) AUC of algorithms in
comparison for SEA dataset
Figure 7.6
OA and AUROC for SEA dataset.
several features are missing from the examples before that date. Each example
consists of eight features. Features 1-2 represent the date and the day of the week
(1-7) for the collection of the example, respectively. Each example is sampled
within a timeframe of 30 min, that is, a period; thus, there are altogether 48
examples collected for each day, which correspond to 48 periods a day. Feature
3 stands for the period (1-48) in which the very example was collected, and thus
is a purely periodic number. Features 1-3 are excluded from the feature set as
they just stand for the timestamp information of the data. According to the data
sheet instruction, feature 4 should also be ignored from the learning process.
Therefore, the remaining features are the NSW electricity demand, the Victo-
ria (VIC) price, the VIC electricity demand, and the scheduled transfer between
states, respectively. In summary, 27
,
549 examples with the last four features are
extracted from the ELEC dataset for simulation.


Search WWH ::

Custom Search