Information Technology Reference
In-Depth Information
of the virtual instances created by SMOTE becomes support vectors. Therefore,
SMOTE spends much time to create virtual instances that will not be used in the
model. On the other hand, VIRTUAL has already a short training time and uses
this time to create more informative virtual instances. In Table 6.4, the numbers
in parentheses give the ranks of the
g
-means prediction performance of the four
approaches. The values in bold correspond to a win and VIRTUAL wins in nearly
all datasets. The Wilcoxon-signed-rank test (two-tailed) between VIRTUAL and
its nearest competitor SMOTE reveals that the zero median hypothesis can be
rejected at the significance level 1% (
p
=
10
−
4
), implying that VIRTUAL
performs statistically better than SMOTE in these 14 datasets. These results
demonstrate the importance of creating synthetic samples from the informative
examples rather than all the examples.
4
.
82
×
6.5 DIFFICULTIES WITH EXTREME CLASS IMBALANCE
Practical applications rarely provide us with data that have equal numbers of train-
ing instances of all the classes. However, in many applications, the imbalance in
the distribution of naturally occurring instances is extreme. For example, when
labeling web pages to identify specific content of interest, uninteresting pages
may outnumber interesting ones by a million to one or worse (consider identi-
fying web pages containing hate speech, in order to keep advertisers off them,
cf. [33]).
The previous sections have detailed the techniques that have been developed to
cope with moderate class imbalance. However, as class imbalances tends toward
the extreme, AL strategies can fail completely—and this failure is not simply
due to the challenges of learning models with skewed class distributions, which
has received a good bit of study and has been addressed throughout this topic.
The lack of labeled data compounds the problem because techniques cannot con-
centrate on the minority instances, as the techniques are unaware which instances
to focus on.
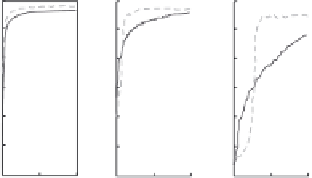
Figure 6.10 compares the AUC of logistic regression text classifiers induced by
labeled instances selected with uncertainty sampling and with RS. The learning
1:1
10 : 1
100 : 1
1000 : 1
10000 : 1
1
1
1
1
1
0.9
0.9
0.9
0.9
0.9
0.8
0.8
0.8
0.8
0.8
Random
Uncertainty
0.7
0.7
0.7
0.7
0.7
0.6
0.6
0.6
0.6
0.6
0.5
0.5
0.5
0.5
0.5
0.4
0.4
0.4
0.4
0.4
0
5000
10,000
0
5000
10,000
10,000
Labeled examples
0
5000
0
5000
10,000
0
5000
10,000
Figure 6.10
Comparison of random sampling and uncertainty sampling on the same
dataset with induced skews ranging from 1 : 1 to 10
,
000 : 1.


Search WWH ::

Custom Search