Information Technology Reference
In-Depth Information
crude7770
1
AL SV
+
:SV
−
0.9
RS SV
+
:SV
−
0.8
0.7
0.6
0.5
0.4
0.3
0.2
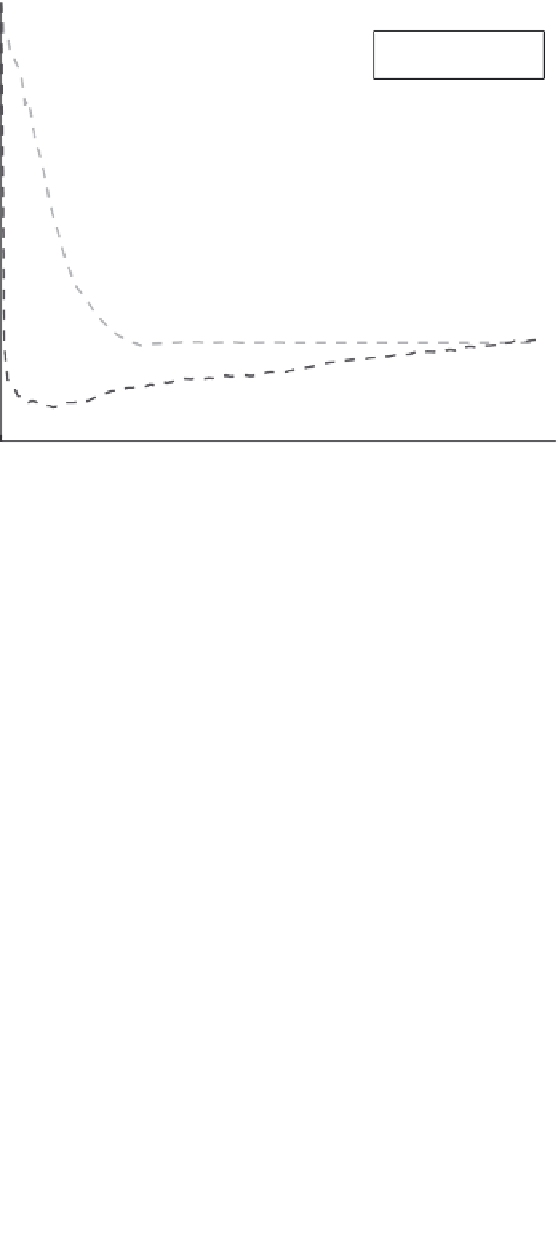
Data ratio: 0.0527
0.1
0
0
1000
2000
3000
4000
5000
6000
7000
8000
Figure 6.5
Support vector ratios in AL and RS.
reaches the final support vector imbalance ratio. Note that both methods achieve
similar support vector imbalance ratios when learning finishes, but AL achieves
this in the early steps of the learning.
It is also interesting to consider the performance of AL as a selection heuristic
in light of more conventional sampling strategies. Here, AL is compared to tra-
ditional under-sampling of the majority class (US) and an oversampling method
(SMOTE, synthetic minority oversampling technique), both being examples of
resampling techniques that require preprocessing. It has been shown that oversam-
pling at random does not help to improve prediction performance [29]; therefore,
a more complex oversampling method is required. SMOTE oversamples the
minority class by creating synthetic examples rather than with replacement. The
k
nearest positive neighbors of all positive instances are identified, and synthetic
positive examples are created and placed randomly along the line segments join-
ing the
k
-minority class nearest neighbors.
For additional comparison, the method of assigning different costs (DCs) to
the positive and negative classes as the misclassification penalty parameter is
examined. For instance, if the imbalance ratio of the data is 19 : 1 in favor of
the negative class, the cost of misclassifying a positive instance is set to be
19 times greater than that of misclassifying a negative one. We use the online
SVM package LASVM
5
in all experiments. Other than the results of the methods
5
Available at http://leon.bottou.org/projects/lasvm


Search WWH ::

Custom Search