Database Reference
In-Depth Information
The S-Curve and Innovation Management
The S-curve, a quantitative trend-extrapolation technique used in fore-
casting, has long been used in the technology industry. Many argue that
this analysis is actually more useful to see where you've been rather than
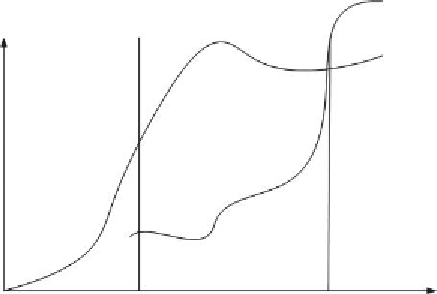
where you should go (Spencer 2005). The S-curve is most often used to
compare two competitive products in two dimensions: usually time and
performance, as shown in Figure 1.3.
An excellent example of an S-curve can be found in Alexander (2001), in
his discussion of the product innovation cycle. He discusses the S-curve of
the ubiquitous automobile. In 1900 the automobile was first introduced to
the public and became the plaything of the rich. Between 1900 and 1914,
the automobile went through the lower curve of the cycle, or the inno-
vation phase, at the end of which Henry Ford introduced the assembly
line. Between 1914 and 1928, according to Alexander, the automobile went
through its growth phase. It was during this phase that the automobile
caught on and was adopted by the general public. By 1928, the automobile
was in its maturity phase (the top part of the S-curve), and Ford was seeing
leaner, meaner competition.
The S-curve can unleash unparalleled creativity when you realize the
time has come for your company to make its entry into the marketplace.
It's at this point that you've got to get your product out there in a way
that effectively competes with the established giant. This often translates
New rival
Established
technology
T1
T2
Time/Investment
FIGURE 1.3
The S-curve for an established technology and a new rival.
Search WWH ::

Custom Search