Biology Reference
In-Depth Information
TABLE 10.1
Limiting Solubility of Cholesterol in Various PC and PE
Lipid Membranes. Values were Obtained from X-ray
Diffraction (
Figure 10.4
) and I-q plots (
Figure 10.5
)
[9]
.
Cholesterol
solubility
(mol%)
Cholesterol
solubility
(mol%)
PE
PC
3
1
3
4
16:0
18:1
51
16:0
18:1
65
e
e
2
2
16:0
18:2
49
e
3
2
1
5
16:0
20:4
41
18:0
20:4
49
e
e
3
2
3
6
16:0
22:6
31
18:0
22:6
55
e
e
1
3
3
6
22:6
22:6
8.5
22:6
22:6
11
e
e
more cholesterol than PE bilayers with identical acyl chain composition. Also, within a family
of either PCs or PEs, cholesterol is more excluded from bilayers as a function of increasing
acyl chain double bond content. Of particular interest is the extremely low solubility of
cholesterol in PC or PE membranes containing two chains of docosahexaenoic acid (DHA,
22:6
D
4,7,10,13,16,19
), the most unsaturated fatty acid commonly found in membranes. This
experiment confirms the idea that the more flexible the acyl chain, the less accommodating
it is for cholesterol.
X-RAY DIFFRACTION
1000
L 001
10
chol
001
chol
001
chol
002
100
L
002
L
004
chol
200
10
chol
020
0.0
0.1
0.2
chol %
50.0
40.0
37.5
35.0
32.5
1
0.5
1.0
Scattering vector q, A
-1
1.5
2.0
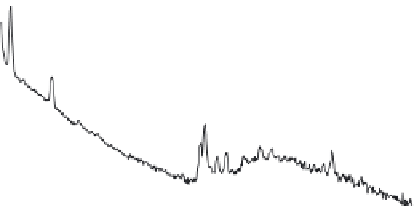
FIGURE 10.4
I-q plots for 16:0, 22:6 PE membranes showing the intensities of cholesterol monohydrate peaks
with added cholesterol. The integrated intensities of the scattering peaks 002 (0.3701
˚
1
), 020 (1.033
˚
1
), and 200
(1.044
˚
1
) were combined and plotted against the mol% cholesterol in Figure 10.5
[9,10]
.