Biology Reference
In-Depth Information
FIGURE 9.13
Michael Edidin. Courtesy of Michael Edidin
Photobleach
1
4
percent
fluorescence
3
X
Y
2
time
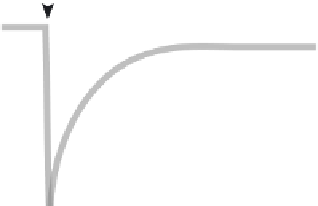
FIGURE 9.14
Data obtained for a typical FRAP experiment. The initial fluorescence background for the
unbleached cell is indicated by line (1). Photobleaching (arrow) decreases fluorescence in the spot (2). The net loss in
fluorescence is X. Brownian motion allows for recovery of fluorescence in the spot (3). Eventually fluorescence
returns in the spot to a new baseline (4) that is lower than the pre-bleached fluorescence (1). The fluorescence
recovery is Y (Y
X). The % recovery is therefore Y/X x 100 and represents the percent of the membrane
component that is diffusible. The percent of the membrane component that is non-diffusible is 100
<
(Y/X x 100).
Lateral mobility is directly related to the slope of the recovery process. A steeper slope indicates a faster recovery
and higher diffusion rate.
[20]
a cell with a fluorescent-labeled antibody or other lipid or protein-specific fluorescent tag.
For example, a fluorescent lectin could be bound to a specific glycolipid or glycoprotein.
The next step involves acquiring a basic fluorescence background image of the cell surface
that will be photobleached. A small diameter, intense light pulse is then used to rapidly