Geoscience Reference
In-Depth Information
(a)
2
0
−2
(b)
2
Observation
Excitation
0
−2
(c)
2
0
−
2
1980
1985
1990
1995
2000
2005
2010
Year
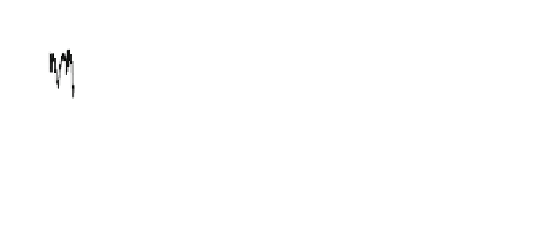
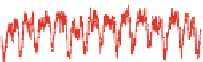
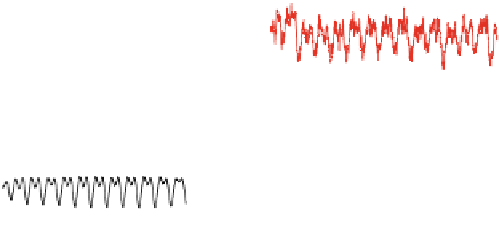
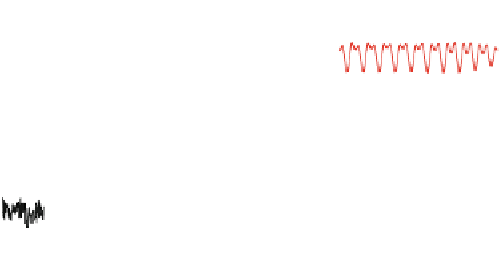
Fig. 16
Comparison of observed changes in length of day (
black line
) and axial atmospheric
angular momentum (
red line
) for the time span 1980-2010.
a
Initial time series after elimination of
secular trend, decadal variations and the effect of solid Earth tides.
b
Annual and semiannual signal
components obtained by Wavelet filtering.
c
Residual time series (
a-b
)
The obtained residual signal, as depicted in Fig.
16
a, is highly correlated with axial
AAM fluctuations (correlation coefficient
96) that chiefly arise from strong
zonal winds. At the frequency bands examined, both the contribution of atmospheric
pressure variations and oceanic angular momentum are of minor extent.
The annual and semiannual signal components in LOD, in particular, are almost
entirely driven by atmospheric processes. This remarkable correlation (
ρ
≈
0
.
00)
between geodetic observations and AAM is demonstrated in Fig.
16
b, which displays
the superposition of these two distinct spectral components. The time-variable ampli-
tudes at
ρ
≈
1
.
2 cpy have been extracted from the respective Wavelet
transforms of the initial LOD and AAM records. Mean magnitude values estimated
from the utilized series amount to 0.36ms for the annual oscillation and 0.27ms for
the semiannual oscillation. These two components can be reduced from the corre-
sponding time series in Fig.
16
a in order to shed light on the residual LOD and axial
excitation signals. Figure
16
c depicts those residuals, which are indicative of two
prominent interannual atmospheric fluctuations, the El Ni
σ
=
1 cpy and
σ
=
no-Southern Oscillation
(ENSO) and a weak quasi-biennial oscillation (QBO), cf. Chao (
1989
). The QBO
represents a regular alternation in the temperature regimes and zonal wind fields of
the equatorial stratosphere (Holton and Lindzen
1972
). Its period varies from 24 to
30 months, while the impact on LOD is about 0.1ms as revealed by spectral analysis
˜