Geoscience Reference
In-Depth Information
C
nm
S
nm
cos
m
sin
0
d
p
P
nm
(
r
n
+
2
g
r
1
λ
=−
cos
θ)
θ
d
θ
d
λ.
sin
m
λ
(
2
n
+
1
)
Ma
n
p
s
Earth
(35)
A
gain, to analyze gravity field variations caused by atmospheric effects, a quantity
p
VI
representing the mean state of the atmosphere, has to be subtracted from the
inner integral, leading to:
Δ
C
nm
Δ
0
cos
m
λ
sin
m
sin
r
n
+
4
d
p
p
VI
P
nm
1
=−
−
(
cos
θ)
θ
d
θ
d
λ.
S
nm
Ma
n
+
2
g
0
λ
(
2
n
+
1
)
p
s
Earth
(36)
To evaluate the significance of the vertical structure of the atmospheric column,
the spherical harmonic series resulting from the TL approach and the ones of the VI
are compared. In Fig.
13
the degree standard deviation of the coefficients of the year
2008 up to degree 100 are plotted, in blue the vertical integration approach, in red
the corresponding difference to the thin layer approach. The results indicate that at
the 2010 error level of RL04 (solid line in Fig.
13
) the differences between the two
approaches are negligible. But if GRACE reaches the targeted error level (dashed
line in Fig.
13
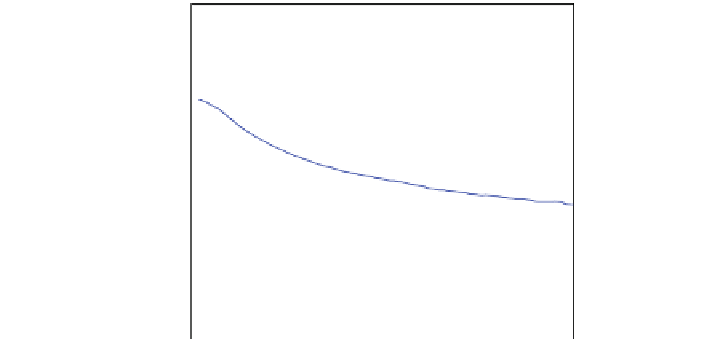
), then the VI approach has to be chosen. Figure
14
shows exemplarily
the geoid height variability for the
C
20
coefficient, in black for the vertical integration
in blue for the thin layer approach, in red the difference.
10
0
VI
VI − TL
GRACE sensitivity
theoretical sensitivity
10
−2
10
−4
10
−6
10
−8
10
−10
0
20
40
60
80
100
Degree
Fig. 13
Degree standard deviation in terms of geoid height for the year 2008 in meter, in
blue
for
the VI approach, in
red
the corresponding difference between VI and TL. The
black line
marks the
GRACERL04 error level, the
dashed
one the theoretical error as obtained by pre-launch simulations