Geoscience Reference
In-Depth Information
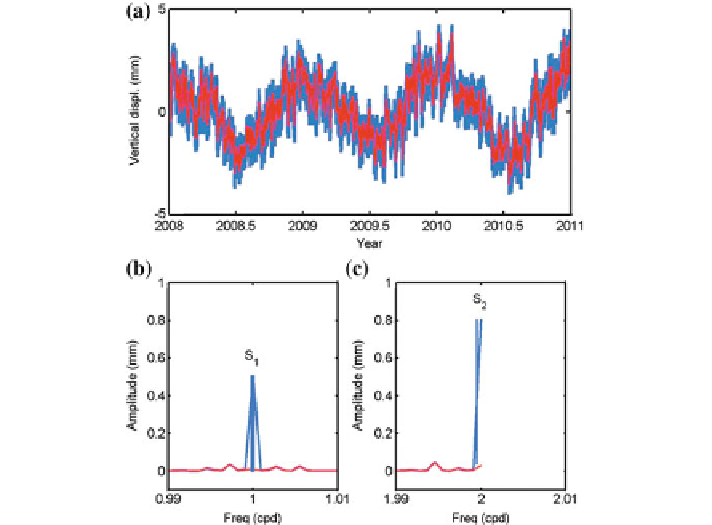
Fig. 5 a
Time series with (
blue
) and without (
red
) tidal loading of vertical displacements at
Fortaleza, Brazil and (
b
,
c
) the corresponding amplitude spectra of atmospheric loading signals
Following Petrov and Boy (
2004
), we derived the pressure tide model for each
node of a 1
◦
global grid of the ECMWF by estimating mean pressure, sine and
cosine amplitudes of the
S
1
(
)
signal in the six-hourly pressure level data over the period from 1980.0 to 2011.0.
After subtracting themodeled sinusoids fromsix-hourly pressure fields, Eqs. (
9
)-(
11
)
were applied in order to obtain non-tidal loading displacements. Figure
5
shows the
non-tidal loading vertical displacements at Fortaleza station (low-latitude, 3.88
◦
S)
in the time domain and the amplitude spectra of the corresponding atmospheric
loading signals. Strong peaks containing tides at the frequencies of
S
1
(
p
)
signal, and sine and cosine amplitudes of the
S
2
(
p
)
are reduced to negligible magnitudes when the tidal signals in surface pressure are
removed. The total loading displacement is the sum of non-tidal displacement and
the harmonic model of tidal loading displacements (see Sect.
2.1.2
).
Examples for signals of non-tidal loading displacements at Fortaleza andWettzell
(mid-latitude, 49.15
◦
N) in vertical and horizontal directions are shown in Fig.
6
.
The horizontal displacements are derived by taking the square-root of the sum of
the squares of the East and North components. The displacements at Fortaleza are
typical for coastal and lower latitude sites as the variations are fairly low due to
smaller pressure fluctuations near the equator and because of the IB effect, due to the
proximity to the Atlantic Ocean. The displacements at a mid-latitude and non-coastal
site (Wettzell) indicate large vertical variations in the order of 5-15mm.
p
)
and
S
2
(
p