Environmental Engineering Reference
In-Depth Information
100%
90%
80%
70%
60%
Other sources
50%
Transport
40%
30%
20%
10%
0%
1,3-
butadiene
[1.7]
Carbon
monoxide
[1,999]
Nitrogen
oxide
[684]
Particulates
(PM
10
)
[41]
Benzene
[3.5]
Sulphur
dioxide
[43]
Lead
[0.003]
Figures in brackets show amount in 1,000 tonnes
Figure 3.8
Transport as a source of air pollution in UK 2005
120
100
80
60
40
20
0
1990
2005
1990
2005
1990
2005
1990
2005
Particulates
(PM
10
)
Carbon
monoxide
Nitrogen
oxides
Lead
Road transport
Other transport
Non transport end users
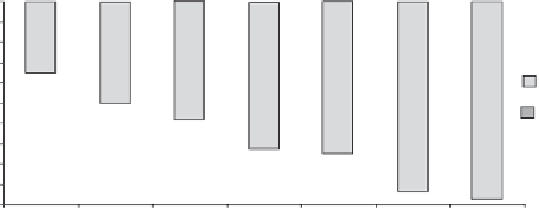
Figure 3.9
Change in pollutant emissions from transport and other end users UK 1990-2005
After successive reductions lead was finally eliminated from the content of petrol in
2000. At the same time the benzene and sulphur content of motor fuels was also much
reduced. Figure 3.9 shows the proportionate reduction in emissions from all sources
since 1990 (for the four pollutants for which published data is available from TSGB)
and, within these, the amount generated from road and other forms of transport.
The significance of the emissions which remain depends on their distribution in
time and space. Concentrations which occur where people are exposed to them are
of particular concern. A system of local air quality management has been introduced
under which local authorities are required to monitor local concentrations of pollutants
and to designate air quality management areas (AQMAs) where target levels are likely
to be exceeded (14.8). The latest national review notes that to date around 200 local
authorities in the UK have designated parts or all of their districts as an AQMA (Defra
2007). The majority of these have been declared because of NO
2
and PM
10
targets
being exceeded, mainly due to road transport emissions.


Search WWH ::

Custom Search