Environmental Engineering Reference
In-Depth Information
9,000
8,000
7,000
All other road users
6,000
5,000
Motor cyclists
4,000
3,000
Pedal cyclists
2,000
Pedestrians
1,000
0
Figure 3.5
Fatalities per year on the highway network 1950-2006 by user group
All casualties (thousands)
Casualty rate per 100 million vehicle miles
450
200
180
400
160
350
140
300
120
250
100
200
80
150
60
100
40
50
20
0
0
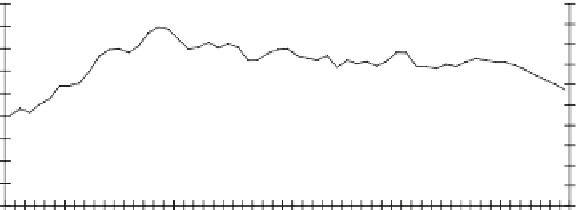
Figure 3.6
Road casualties and casualty rates 1950-2006
economic terms which as a nation we seem willing to pay in return for our enhanced
mobility. Currently there are still some 3,000 people a year killed on the roads.
Almost 80 people are killed or seriously injured on the roads every day. Individually
these tragic incidents are so commonplace that they are barely reported even in the
local media. By contrast rail crashes, when they occur, are the source of national
headlines. Over the last decade an average of six people
a year
have been killed in train
crashes and about double this number killed accidentally through train movements.
Probably less well recognised is the fact that, for vehicle occupants, the fatality rate of
travel by bus and coach is one-eighth of travel by car.
For all types of road casualty - KSI (killed or seriously injured) and other - the
overall picture since 1950 in terms of total numbers and rates per passenger mile is
shown in Figure 3.6. This demonstrates that until the 1960s when the main road-
building programme got under way, casualty rates remained much the same so that,
with the rapid increase in traffic, the number of casualties grew steeply. The peak
year was 1965. Thereafter improvements in the casualty rate kept just ahead of the
increase in traffic so the number of casualties declined slightly. Since the late 1990s
a targeted policy initiative has achieved a further improvement in the casualty rate
and this coupled with a slowing of traffic growth has resulted in a drop of one-fifth in
casualties in just the six years since 2000-2006.


Search WWH ::

Custom Search