Environmental Engineering Reference
In-Depth Information
10,000
9,000
8,000
7,000
6,000
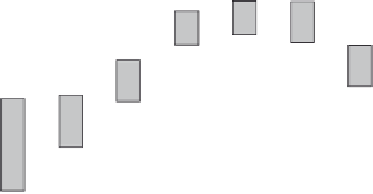
Walk/cycle
5,000
Public transport
4,000
3,000
Car passenger
2,000
Car driver
1,000
0
<17
17-20
21-29
30-39
40-49
50-59
60-69
70+
Figure 2.8
Travel per person by age group and by mode
walking. At age 70-74, 27% of men and 32% of women have difficulty walking.
Beyond the age of 80 more than 1 in 6 men and 1 in 4 women do not go out on foot at
all. The significance of these figures is compounded by the lower availability of cars to
older people noted in the previous chapter. Together they have important implications
for physical and emotional well-being as well as practically and financially in obtaining
even basic goods and services.
Traditional differences in the use of transport modes between the sexes remain
apparent. Men and women make a similar number of trips by car but 74% of men's
trips are made as drivers compared with only 58% of women's. In using public transport
men make proportionately more use of trains; women of buses. In particular women
aged 17-20 and over 70 make about 1 in 6 of all their trips by bus. Men make more
trips by bike than women. Women make more trips on foot in all age groups even
though their mobility difficulties amongst the over 60s are greater.
Children's travel to school has aroused public concern and the attention of policy-
makers. Current behaviour is in fact little different from the mid-1990s. Amongst
children aged 5-10 the proportion walking and being taken by car is 52% and 41%
respectively compared with 53% and 38% a decade ago. Amongst children aged 11-16
the current figures are 41% and 20%, virtually unchanged during this period. (These
figures do however contrast with a decline in walking during the previous decade.)
Two out of five children in the older group travel to school alone but, glaringly, fewer
than 1 in 30 cycle.
60
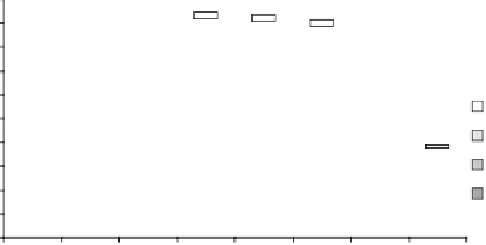
Does not (unable to)
go out on foot
Does not go out on foot;
could do with difficulty
Difficulty walking;
needs help or aid
Difficulty walking;
walks unassisted
50
40
30
20
10
0
50-54
55-59
60-64
65-69
70-74
75-79
80+
Age
Figure 2.9
Walking difficulty by age group (amongst people over 50) (source: Noble (2000) from
NTS 1992/98)


Search WWH ::

Custom Search