Environmental Engineering Reference
In-Depth Information
1,400
Leisure
Visiting friends
1,200
1,000
Personal business
/other escort
800
Shopping
Education (inc
escort)
600
400
200
Commute/business
0
<17
17-20 21-29 30-39 40-49 50-59 60-69
70+
Age group
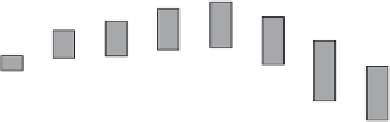
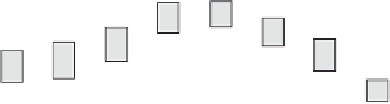
Figure 2.4
Trips by age by purpose (source: National Travel Survey 2006, Table 4.3)
and old age have their effect. Overall the number of trips per person ranges from
1,158 to 882 a year amongst members of households in the highest and lowest income
quintiles and between 1,096 and 775 for those with and without cars. Car availability
and licence-holding
within
car-owning households generate a further differential.
People who are main drivers make 19% more trips than the all-person average and
spend 17% more time travelling.
2.8 Personal travel by mode and trip purpose
In the previous section we noted that the volume of trip-making and the time spent
travelling have changed very little and for the most part do not differ greatly between
sections of the population. The same is not true of distance travelled or mode share and
it is changes in these factors which underlie the long-term growth in travel generally
and car travel in particular.
Because of the contemporary scale of car use it is not practicable to show the
historical trends for all modes of travel in a single graph. Figure 2.5 therefore shows
the split between car and all other mechanised modes. (Walking is not included in this
data source.) Figure 2.6 shows the split between the individual non-car modes. Note
that the vertical scale of the second figure is much enlarged and that the contribution
of each mode is shown cumulatively.
Between the early 1950s and the mid-1960s car use grew at a rapid rate and
increased its share from a quarter to two-thirds of all passenger travel. During the same
period bus use and pedal cycling plummeted in absolute and relative terms. Thereafter
although overall travel continued to grow, these particular trends slowed. By 1980 car
use had grown to 80% of the total.
The steadiness of long-term trends was upset in the late 1980s and early 1990s
by the economic 'boom and bust' of the time. However the previous pattern never
re-established itself as the economy returned to normal and 1994 marks a watershed.
Since this date travel by car has increased more slowly than hitherto and travel by
other modes has undergone a striking turnround. In the period to 2006 total travel
increased by 15%, car travel by 13% and other modes by 34%. As a result the share
of all domestic travel undertaken by car has actually
declined
- from 87% to 85%.


Search WWH ::

Custom Search