Environmental Engineering Reference
In-Depth Information
300
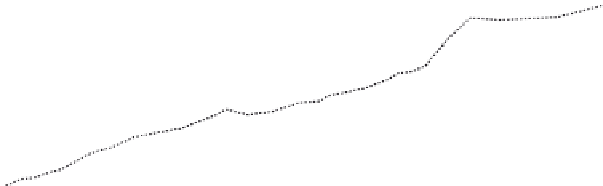
Total passenger km
Total tonne km
GDP
250
200
150
100
500
0
1958
1963
1968
1973
1978
1983
1988
1993
1998
Figure 1.1
Growth in passenger and freight transport compared with GDP 1958-98 (source:
Chart 3a Transport 2010 DETR 2000f)
Table 1.1
Average length of passenger journeys and freight haul 1976 and 2006
1976
2006
% change
Journeys: Number per person per year
935
1,037
+11%
Average journey length (miles)
5.2
6.9
+33%
Freight: Goods lifted (m. tonnes)
1,857
2,203
+19%
Average length of haul (kms)
82.4
118.5
+44%
distance categories (Potter 1996). Significantly these are distances which are typical of
journeys to, around or between towns rather than within them. The 10-25 mile band
is also the one which has the highest proportion by car (85%).
This link between transport and economic development can be viewed as operating
negatively as well as positively. Capacity limits on transport networks and worsening
congestion are commonly held to inhibit economic growth and are thus used as an
argument for greater investment to rectify an 'infrastructure deficit'. This raises the
question of whether the observed relationship between growth in the economy and
in transport is a necessary one or whether it is possible to 'decouple' them. (The issue
is critical to the possibility of sustainable development over the longer term which we
discuss in Part 5.)
At this point we may simply note that there is some evidence of this decoupling in
recent years. Since the early 1990s the overall amounts of passenger and goods traffic
have risen more slowly than the national economy even though, by historical standards,
this period has been characterised by an exceptionally long period of continuous
growth. In the decade to 1996 GDP increased by 21% whilst goods movement and
passenger travel, following their traditional close association, increased by 21% and
19% respectively. In the decade to 2006 however GDP increased by 32% but the
equivalent increases in transport were only 9% and 11%. (For further consideration of
this important change see Headicar 2008.)


Search WWH ::

Custom Search