Database Reference
In-Depth Information
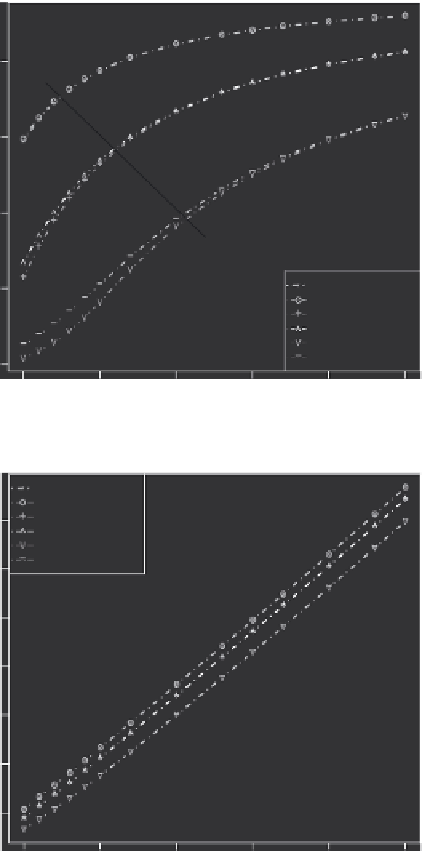
(a)
Mean service time = 60 min, 1 PM in each pool
Increasing VM
capacity
interacting: 1VM
monolithic: 1 VM
interacting: 2 VMs
monolithic: 2 VMs
interacting: 4 VMs
monolithic: 4 VMs
5
10
15
Arrival rate (jobs/hr)
20
25
30
(b)
Mean service time = 60 min, 1 PM in each pool
interacting: 1VM
monolithic: 1 VM
interacting: 2 VMs
monolithic: 2 VMs
interacting: 4 VMs
monolithic: 4 VMs
Increasing VM
capacity
5
10
15
Arrival rate (jobs/hr)
20
25
30
FIGURE 18.9
(a) Job rejection probability vs. arrival rate and (b) mean number of jobs in
RPDE vs. arrival rate.
the monolithic model are negligible and interacting submodels approach preserves
accuracy while being scalable. Such errors stem from the fact that we solve only one
model for all the PMs in each pool, and aggregate the obtained results to approxi-
mate the behavior of the pool as a whole. As a result, values of the probabilities
(e.g.,
P
h
,
P
w
,
P
c
) that at least one PM is able to accept a job in a pool are different in
monolithic (exact) model and interacting (approximate) submodels.


Search WWH ::

Custom Search