Database Reference
In-Depth Information
(a)
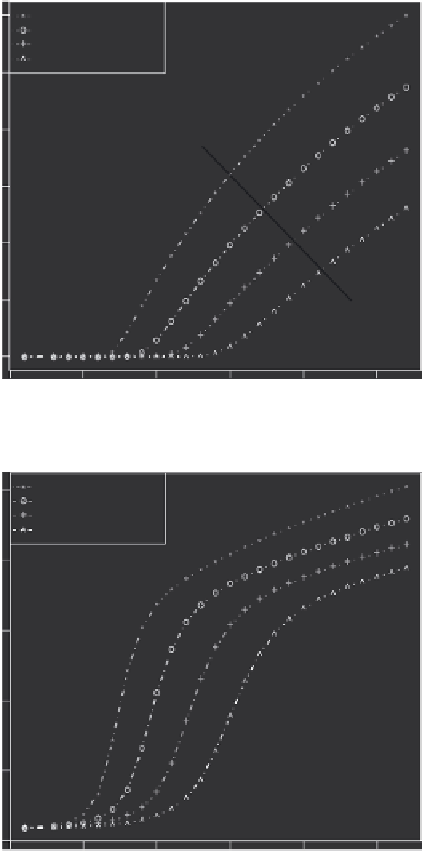
Maximum 4 VMs per PM, arrival rate = 1000 jobs/hour
70 PMs in each pool
80 PMs in each pool
90 PMs in each pool
100 PMs in each pool
Increasing PM capacity
0
500
1000
1500
2000
2500
Mean service time (minute)
(b)
Maximum 4 VMs per PM, arrival rate = 1000 jobs/hour
70 PMs in each pool
80 PMs in each pool
90 PMs in each pool
100 PMs in each pool
Increasing PM capacity
0
500
1000
1500
2000
2500
Mean service time (minute)
FIGURE 18.8
(a) Job rejection probability vs. mean job service time and (b) mean response
delay vs. mean job service time at a different number of PMs.
gain diminishes once again. This result demonstrates that using the developed per-
formance model, one can do what-if analysis for the overall system. Specifically,
we show that in overall mean response delay, bottleneck component (mean queu-
ing delay in this case) shifts as the job characteristics (mean service time in this
example) and cloud capacity (PMs in each pool) are changed.


Search WWH ::

Custom Search