Database Reference
In-Depth Information
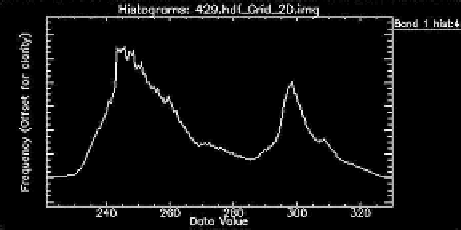
FIGURE 15.11
A representative histogram for land surface temperature.
of orthogonal vectors. Each orthogonal (principal) vector accounts for a certain
amount of variance in the data, with a decreasing degree of importance. PCA-based
data clustering was used to investigate how the response vectors from the different
sensors are clustered into multisensor space. The main aim of this analysis was to
establish a list of least correlated attributes, which contribute toward most data vari-
ance. This clustering approach was used on normalized data. Individual feature or
variable data column was normalized to avoid any unnecessary data value imbal-
ance. Based on the PCA method, all attributes were sorted according to their corre-
lation coefficients. In this case, as the integrated time series matrix had 40 columns,
coefficient matrix had 40 columns, and 40 rows, where individual column repre-
sented one PC and 40 rows of that column represented data variance contribution of
all 40 variables along that particular PC. Depending on total data, variance number
of PC count was automatically decided. Five principal components were kept, which
accounted for 100% of the variance in data set (PC no. 1, PC no. 2, PC no. 3, PC no. 4,
and PC no. 5) which accounted for 71.67%, 8.85%, 5.23%, 4.57%, and 0.41% of the
variance, respectively, in this particular case study. It was very clear that the first
principal component captured most of the information variance from the data set.
The PCA method was used to get a better understanding of the nature of our data.
For reference, all the load values for the first five PCs are included here. The load-
ings associated with the five least correlated variables, namely, n-count COSMOZ,
Evap SILO, PotEvap AWAP, Temperature MODIS, and rain AWAP were (0.5066
0.0754 0.7806), (0.5135 0.0823 0.7808), (0.2828 0.5490 0.5490), (0.367 0.678 0.4910),
and (0.4754 0.8164 0.2987), respectively. The next five criteria from the sorted list
were EvSp SILO, totalTRANSP AWAP, DeepDrain AWAP, LatHeatFlux AWAP,
and Temperature MODIS. Although these later five variables did not carry signifi-
cant information variance, the loadings associated with them were (0.5613 0.1810
0.6947), (0.5478 0.1608 0.0663), (0.4828 0.5490 0.5490), (0.2828 0.1490 0.4490), and
(0.1754 0.8164 0.2987), respectively. Findings from this dynamic PC analysis were
significant as they were able to reduce the dimension significantly from a big multi-
variate data set, and also provided the valuable recommendation about the statisti-
cally significant attributes. These recommendations were used to form the ultimate
dynamic environmental knowledge recommendation layer.
Search WWH ::

Custom Search