Database Reference
In-Depth Information
(b)
(a)
36
22.5
20.0
17.5
15.0
12.5
10.0
7.5
5.0
2.5
0.0
32
28
24
20
16
12
8
4
0
1.0
1.0
0.8
0.8
0.6
0.6
0.4
0.4
0.2
0.2
0.0
0.0
-2
0
2468 0121416
Click size
-2
0
246810
12
14
16
Click size
(c)
(d)
22.5
20.0
17.5
15.0
12.5
10.0
7.5
5.0
2.5
0.0
36
32
28
24
20
16
12
8
4
0
1.0
1.0
0.8
0.8
0.6
0.6
0.4
0.4
0.2
0.2
0.0
0.0
-2
0246810
12
14
16
-2
02468 0121416
Click size
Click size
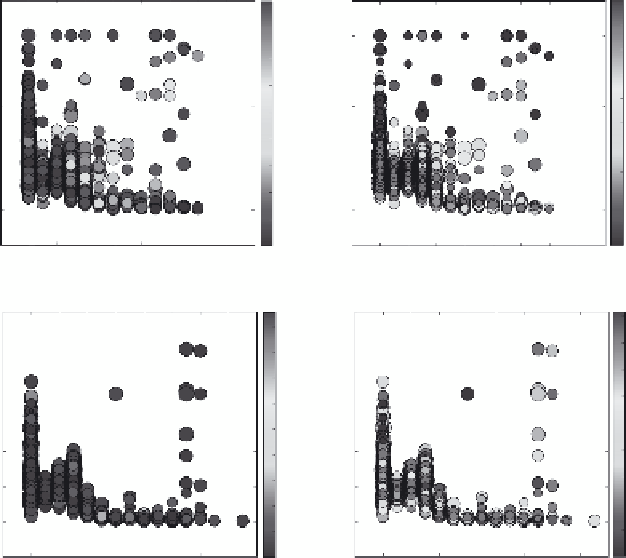
FIGURE 14.9
(a)-(d) The IP size distribution of two groups of publishers, named A and B
for anonymity purpose, which include hundreds of different publishers. Each point represents
the percentage of clicks, of a given size, received by a publisher. For each group of publishers,
two figures are plotted. In (a) and (c), the color indicates the scaled fraud score. The volume
is proportional to the number of clicks associated with the data point. In (b) and (d), the color
indicates the scaled quality score.
quality score. The spikes corresponding to high fraud score also have very low, or
zero, quality score. This confirms that the clicks identified by the anomaly detection
system are indeed abusive clicks.
Figure 14.9c and d illustrates a sample group where the IP size distribution filter
detects machine-generated traffic that would have been undetected otherwise. For
instance, Figure 14.9c shows the case of a publisher that has about 70% of its clicks
in bucket 6. This spike in distribution is particularly suspicious since all other pub-
lishers in the same group have 15% or less click of this size range. The quality score
associated with this point confirms this intuition. In fact, the large number of clicks
(large circle in Figure 14.9d) was associated with very low quality score.
14.5.4.6 Analysis of a Single Bucket
In Figure 14.10, the focus is on bucket 0 of Figure 14.9a, as this is the bucket with
the largest number of data points. The variation of number of filtered clicks, the fraud
Search WWH ::

Custom Search