Database Reference
In-Depth Information
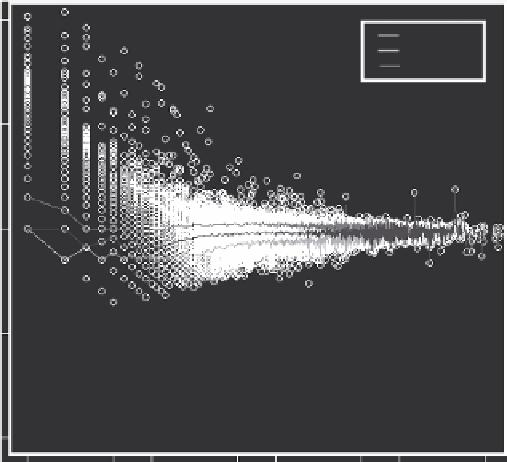
0.9 quantile
0.5 quantile
0.1 quantile
1
5
10
50
100
500 1000
5000
Estimated distinct (user IDs)
FIGURE 14.6
The relative ratio in predicting query sizes by the estimated sizes.
the bottommost quantiles are −6870, −12, −8, −7. Based on Whois databases, the
IPs that caused the largest absolute errors belonged to large commercial ISPs with
several netblocks and diverse customer bases. These IPs probably changed sizes due
to reassignment.
From Figure 14.6, among all the predicted sizes, 98% were within a factor of 2 of
the estimated size. The topmost four 0.001 quantiles of the relative ratios were 5283,
4, 4, and 3, and the bottommost quantiles were 0.2, 0.4, 0.4, and 0.44.
The relative ratio is broken down by the estimated sizes in Figure 14.6. The line
that passes through the
y
-axis point 1 with slope 0 represents perfect predictions.
Clearly, the median quantile-curve is almost overlapping with the perfect predictions
line for medium and large values of estimated sizes. Moreover, the accuracy of the
predictions increases as the estimated size increases, where the accuracy is more
operationally desired.
14.4.5.2 Predictions Coverage
For predictions to be effective, they should have high coverage, that is, a high ratio of
the IPs in the traffic has predictions. There are several factors that contribute to the
predictions coverage, such as the stability of the estimated sizes of the IPs, the diver-
sity of the IPs that visit the application provider, the length of the estimation period,
and the length of the sliding windows of estimates used for prediction.
The coverage of the 3-month experiments dropped below 95% on 2 days and never
dropped below 93%. The coverage of the click sizes was also examined. The click-
coverage averaged around 65% and never dropped below 61%. Since the number of
Search WWH ::

Custom Search