Database Reference
In-Depth Information
degree vertices belong to the set of core vertices inside the GCC but are not necessar-
ily the ones with the smallest radius. Finally, the whisker vertices have small degree
and belong to chain subgraphs.
8.6.5 t
emPoral
P
atterns
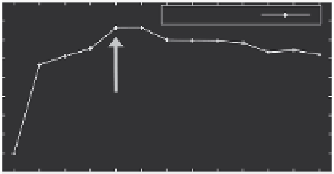
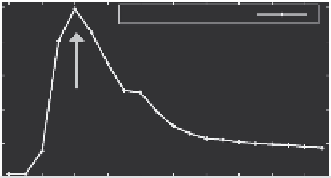
Here we study the radius distribution as a function of time. We know that the diam-
eter of a graph typically grows with time, spikes at the “gelling point,” and then
shrinks [32,38]. Indeed, this holds for our data sets as shown in Figure 8.22.
Figure 8.23 shows our findings. The radius distribution expands to the right until
it reaches the gelling point. Then, it contracts to the left. Finally, the decreasing seg-
ments of several real radius plots seem to decay exponentially, that is,
count
(
r
) ∝ exp (-
cr
)
(8.1)
for every time tick
after
the gelling point.
count
(
r
) is the number of vertices with
radius
r
and
c
is a constant. For the Patent and LinkedIn graphs, the absolute cor-
relation coefficient.
(a)
50
40
U.S. Patent
30
Gelling
point
20
10
0
Date
(b)
9
LinkedIn
8
7
6
5
4
Gelling
point
3
2
1
0
Date
FIGURE 8.22
Evolution of the effective diameter of (a) U.S. Patent and (b) LinkedIn
graphs. The diameter increases until a “gelling” point and starts to decrease after that point.
Search WWH ::

Custom Search